IS ETHUSDT READY TO MAKE ALL TIME LOW!!!
Ethereum – the world’s second-most famous block chain network – is a platform for creating decentralized applications based on block chain and smart contract technology (a command that automatically enforces the terms of the agreement based on a given algorithm). Its crypto currency is listed under the symbol ETH and is also used for various transaction costs on the Ethereum network, such as gas fees (which can be infamously high at times).
Ethereum is considered the second – after Bitcoin – the most stable digital currency. It is called Bitcoin 2.0 and it is a biggest competition, based on the same technology – block chain.
Ethereum is not just the digital coins and opportunity to invest. It is also a block chain based platform that allows you to conclude contracts, establishments and crowd funding. ETH is a fresh currency – it was found in 2015 as a result of ICO (Initial Coin Offering) and during it 60 million coins were distributed to investors, while 12 million stayed with developers. The maximum number of coins is not specified.
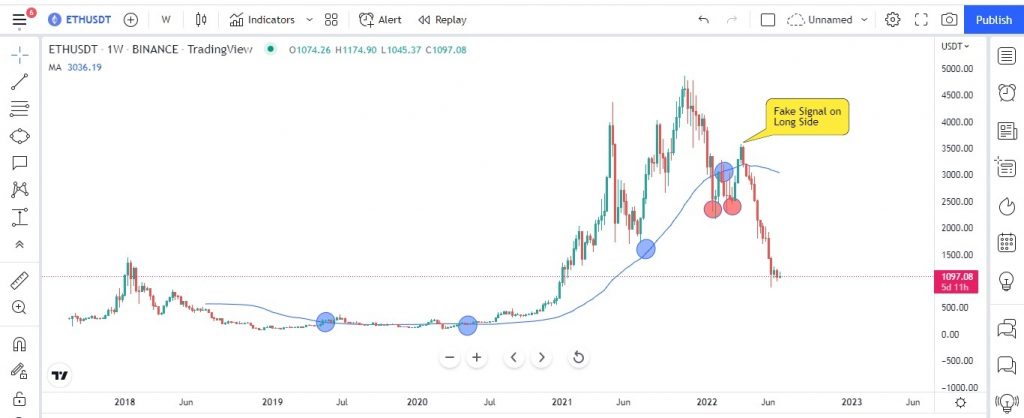
The above chart is for ETHUSDT plotted on a weekly time frame with Simple Moving Average (SMA -50) being added. The price of ETHUSDT took multiple support and started the bull rally starting in the mid of year 2020 and it made an all time high of 4,372 on May 2021. The price did not sustain and retraced back to take support of SMA -50 and once again the bull trend resumed and made a fresh all time high of 4,868 in Nov 2021. Currently, the price is trading below the SMA-50 and making lower low which is a sign of bearishness in the ETHUSD.
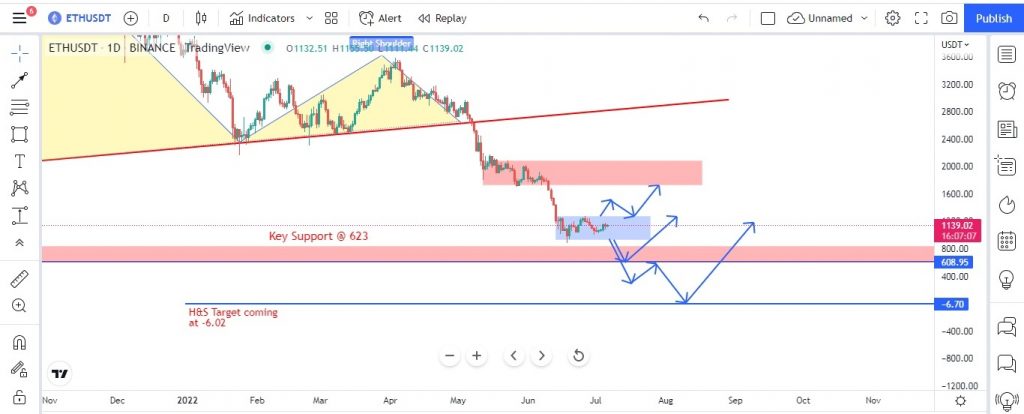
The below chart of ETHUSDT is also on a weekly time frame. One can clearly see the Head & Shoulder pattern is being made and the price have broken the neck line of the H&S pattern.
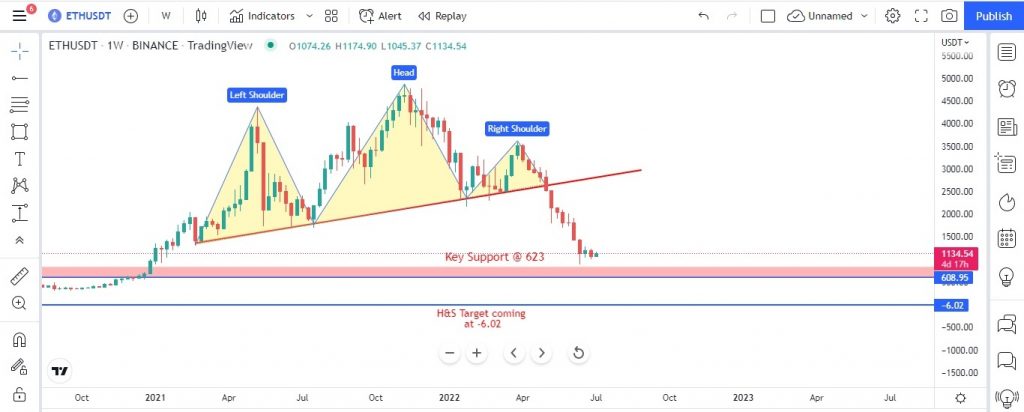
The target for H&S pattern is way below the key support zone of 623 which is in negative 6.03. This means there is possibility of ETHUSDT making all time low in the near future. However, if we see the chart the key support is at 623 which will decide in the near future weather the level will hold or break. The below chart of ETHUSDT is on a daily time frame and currently the prices are in a consolidation phase (please see the rectangle blue box). The possible price action movement is shown with the blue arrow with directions.
Also, at current prices the RSI is indicating it is trying to take support at 40 levels, which indicates the prices may see a retracement for the down trend impulse. One can initiate a long position at current prices with stop loss just below the swing low which is at USDT 890 and for a target of USDT 1492 and USDT 1700 respectively. One can go short if prices sustain below USDT 890 levels for which we need further confirmation from the price action. Please, note the main trend is still downtrend.
Website Disclaimer
The Articles published in Blog sections of HFT Solutions, is for educational purpose only and the author is not a SEC registered analyst. The views and opinions expressed on this website are solely those of the original author(s) and other contributor(s). These views and opinions do not necessarily represent those of HFT Solutions, the https://hftsolution.com/ staff, and /or any/all contributors to this site.
All information on the Site is provided in good faith, however we make no representation or warranty of any kind, express or implied, regarding the accuracy, adequacy, validity, reliability, availability, or completeness of any information on the site. UNDER NO CIRCUMSTANCE SHALL WE HAVE ANY LIABILITY TO YOU FOR ANY LOSS OR DAMAGE OF ANY KIND INCURRED AS A RESULT OF THE USE OF THE SITE OR RELIANCE ON ANY INFORMATION PROVIDED ON THE SITE. YOUR USE OF THE SITE AND YOUR RELIANCE ON ANY INFORMATION ON THE SITE IS SOLELY AT YOUR OWN RISK.