Introducing HFT ALPHA STRATEGY a unique and one of the top performing strategy that is developed and owned by HFT Solutions Pvt. Ltd. keeping in mind the volatility and false breakout while trading and ensure a trader always end in profit with high probability of winning ratio and comes with a low risk appetite. It is 100% non –repainting and signal generated are very accurate with very low stop loss and with a great rewards. It has a profitable percentage of more than 55% (vary from stock to stocks) with a high net profit and with minimal draw down percentage.
Who can use this Strategy?
Well, a Novice trader to a professional trader can use the strategy without any extra effort. Just need to get access from HFT Solutions and add to your chart in Trading view and one can start trading either manually or by automating using BOT. The strategy also plots the entry, stop loss and exit on the chart (Position sizing on the chart on Trading view).
Can this Strategy works on every segments?
Yes, this strategy can be deployed on any stocks/Indexes/commodities/forex pairs/crypto etc. however, we have selected the performance on selected stocks on different time frames where it has performed quite well and one can make money on consistent basis.
Strategy Performance on selected TOP US Stocks on different time frames
The strategy can be traded automatically by connecting to client’s broker and also can be traded manually. Below are the details of the performance of the HFT ALPHA STRATEGY on different time frame for top performing US Stocks –top 10 stocks out of 100 stocks. (With Initial capital of $ 1,00,000, with Risk per trade of 1 percent):
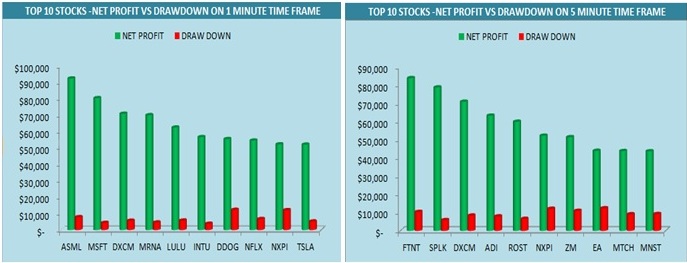
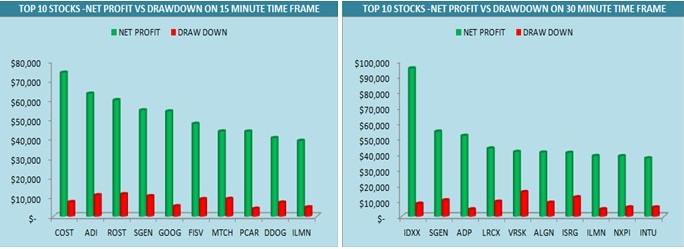
Below chart of HFT ALPHA STRATEGY shows NET PROFIT VS % of PROFITABLE on different time frames.
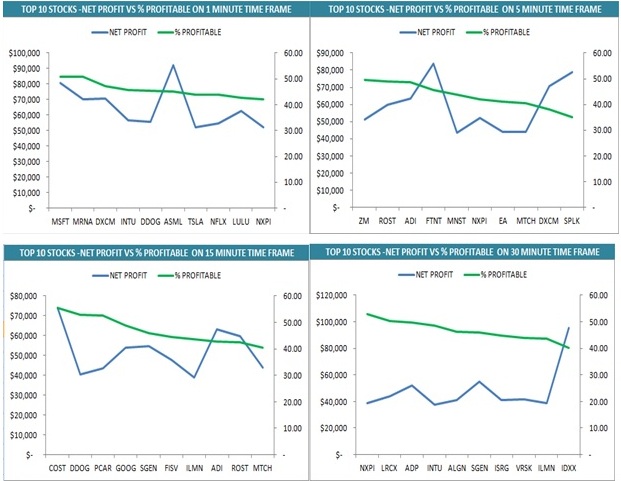
The above data is taken from trading view as on dated 21st July 2022 for different time frames. Please note the data may show a slight variation when testing by clients as the timing of running the BOT during our analysis may vary with the timings of the clients and the data may include new trading that has been executed. Let us see the performance by some of the top performing stocks:
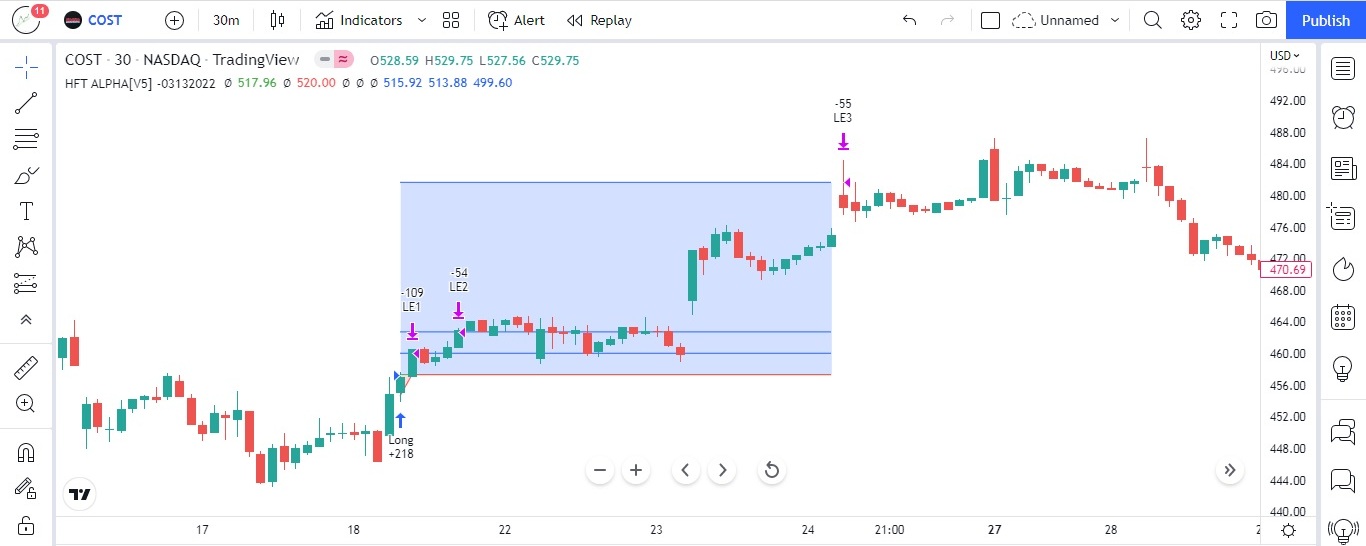
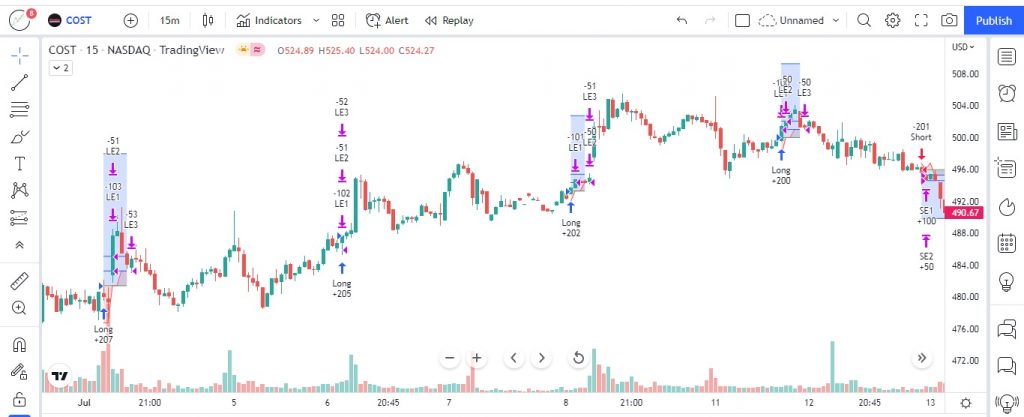
COSTCO WHOLESALE CORPORATION (NASDAQ: COST)
Below chart is of COSTCO on a 15 minute time frame with HFT ALPHA Strategy plotted on the chart shows from dated 1st July 2022. As one can see the there are 4 long position with multiple targets as and when the position is executed, the stop loss is set to last candle low and when target of 1:1 is reached 50% of the quantity is booked and stop loss is moved to break even. Similarly, when target 2 is reached, the stop loss is moved to target 1 and rest will be trailed till all target are completed or stop loss is hit. Here, one can see that the stop loss is very small as compared to big targets. This helps the traders to take a trade with confidence and the quantity are calculated based on the risk taken which is 1% of total capital employed that is $ 1,00,000.
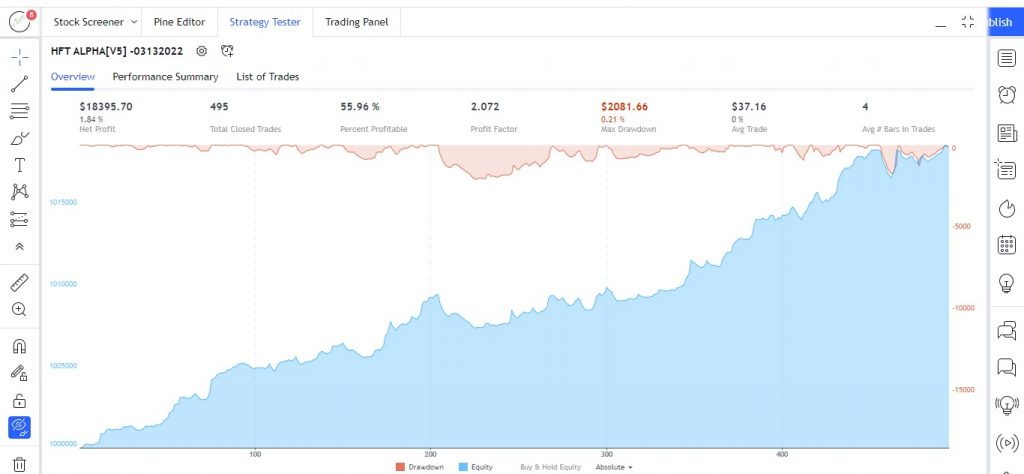
The below chart of COSTO which is plotted on 15 minutes time frame shows the strategy overview. The net profit which is $ 18,395.70 (1.84%) for a max drawdown of $ 2,081.66 (0.21%) with a percentage profitability of 55.96% (with profit factor of 2.072) which is quite good for a novice trader or a professional trader to make money on a consistent basis. Unlike, other indicators which try to catch the tops and bottoms our strategy is able to consider only the middle part where the probability is too high with small stop loss and with great winning ratio. The percentage profitability for intraday is 55.96% which indicates if a trader executes 100 trades out of which 55 are winning trades and 45 are losing trades. This 55% of profitability is combined with small stop loss which gives an extra added edge to make more money with limited losses.
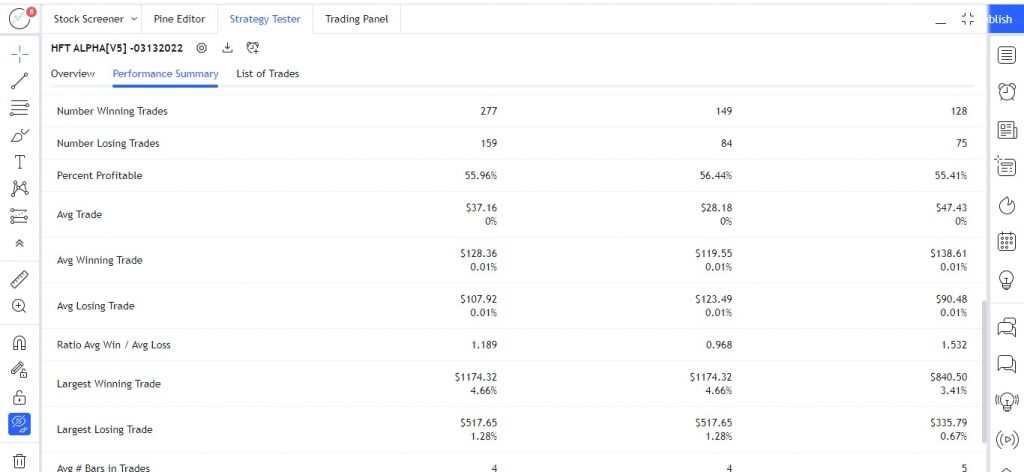
Below chart of COSTCO is on 15 minutes time frame with HFT ALPHA strategy performance summary. As one can clearly see the numbers of winning trades are 277 versus the number of losing trades which is 159. Average winning trade accounts for $ 128.36 to average losing trade of $ 107.92 with a ratio average win/avg loss is about 1.189 which is quite good for the strategy. The largest winning trade accounts for $ 1,174.32 which is 4.66% which itself is a major indication of the strength of the strategy with largest losing trade accounts for only $ 517.65 which is 1.28%. The HFT ALPHA strategy give a buy and sell signal based on various complex conditions, and when met the strategy executes the position which last for an average of 4 -5 bars given multiple options for the traders if they miss any opportunity.
E-MINI NASDAQ -100 FUTURES (SEPT 2022):- CME_MINI: NQU2022
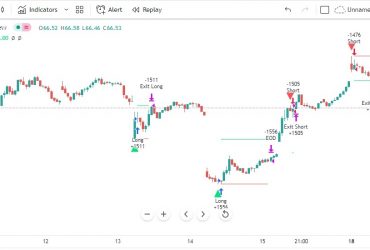
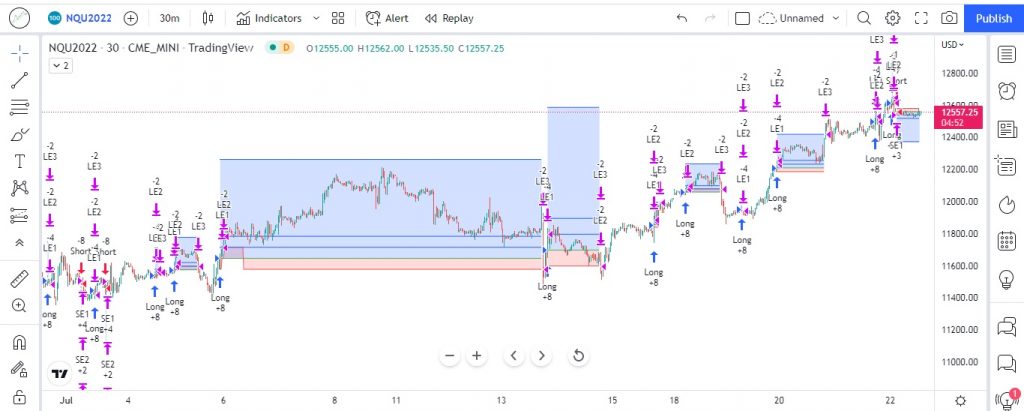
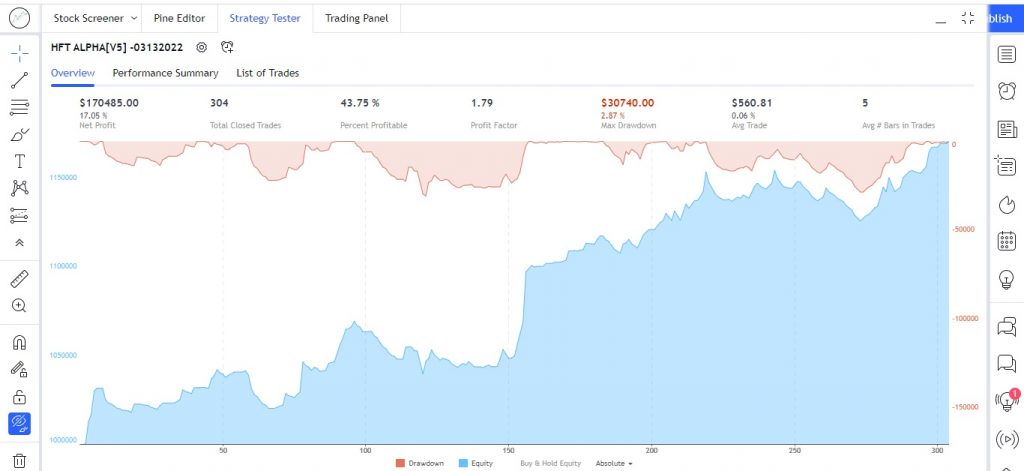
Below chart of E-Mini Nasdaq -100 Futures for September 2022 contract (NQ) is plotted on a 30 minutes time frame starting from July 2022. As one can see the performance of the HFT ALPHA STRATEGY has outperformed with net profit of 17.05% which is $ 1,70,485 with minimal drop down of 2.87% (which is $ 30,740 as on 22nd July 2022 which itself speaks about the core strength of the strategy. Also, from the chart one can see as and when long or short position are opened the stop loss is just below the previous candle highlighted in red color with multiple targets to ride the trend, even if few stop loss are hit the amount contributing to net profit will have minimal effects with a profit factor of 1.79 and with a percent profitable of 43.75 for a capital employed of $ 1,00,000 with a risk of just 1%. However, if one tries to increase the risk to 2% of total capital the result would be much larger than at present value.
Below chart of NQ on 30 minutes time frame shows the overall strategy performance with 304 total closed trades with average trade of 0.06% which is $ 560.81
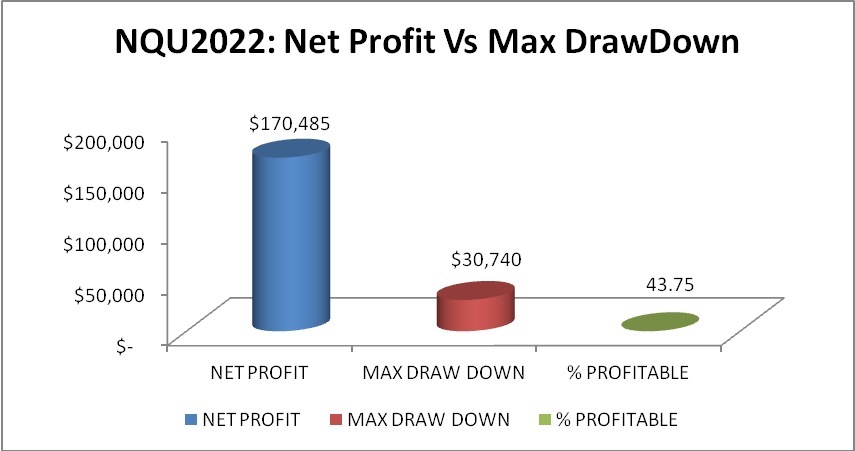
The above chart plots the NQ on 30 minutes time frame with comparison of Net profit vs Max draw down and also showing the % of profitable as on 22nd July 2022 for September Contract series of NQ.

The above chart of NQ on 30 minutes time frame shows the performance summary of HFT ALPHA STRATEGY. The average winning trade is $ 2,904 with average losing trade of $ 1,610 and with ratio of average win /avg loss is at $ 1.804 which is quite good for the strategy.
Also, if we see the largest winning trade has contributed to $ 28,170 in a single go which speaks about the performance of the strategy with largest losing trade which has contributed just $ 7,485 which is 1.3%.
E –MINI S&P 500 FUTURES(SEP 2022): CME_MINI: ESU2022
The below chart of E –Mini S&P 500 futures for September 2022 contract has been plotted with HFT ALPHA STRATEGY on a 30 minutes timeframe. As we have already mentioned for each segment the net profit to max drawdown varies so does our strategy also. Here one can see that the performance of the strategy is 43.67% of profitability which means out of 100 trades the winning trade’s accounts to 43 numbers. The main advantage of this strategy is that instead of less than 50% of profitability the total net profit has increased that’s because of the very low stop loss and big multiple profits.

As one can see from below chart the net profit for ES for September 2022 contract series is about 39.96% which is quite high as compared to NQ which in terms of amount is $ 3,99,625 with a max draw down of 5.85% which accounts for total amount of $ 71,062 which is quite good. The total closed trades is 387 for which if one tries to remove slippages and commission the total final amount is a decent net profit as compared to other strategies.
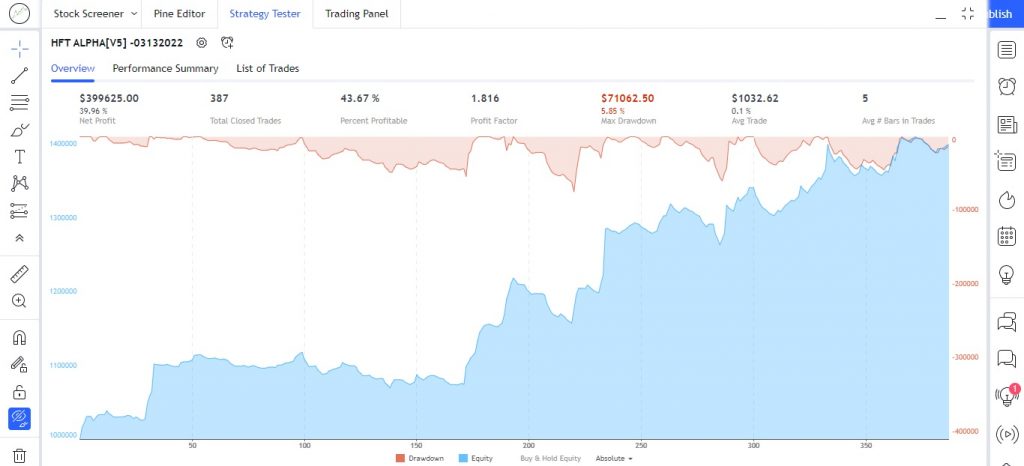
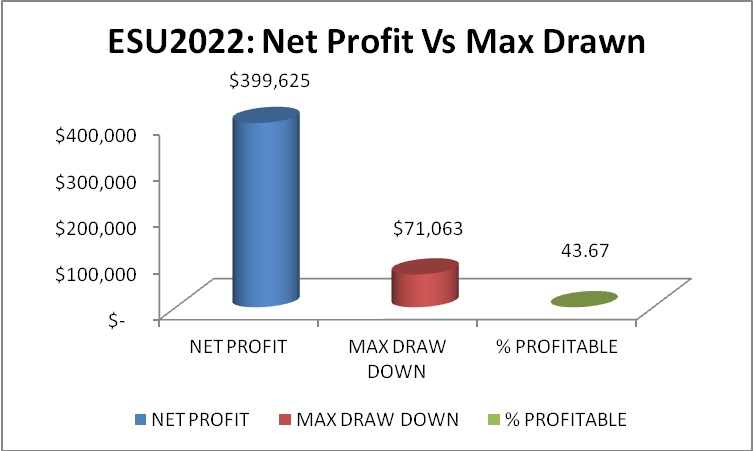
The above chart of ES for September 2022 contract explains the Net profit vs max drawn along with % of profitable on a 30 minutes time frame. Note, the data is as of 22nd July 2022 for a capital of $ 1,00,000 with a risk appetite of 1% excluding commission and slippages. Below chart is the HFT ALPHA STRATEGY performance summary for ES for September 2022 contract on 30 minutes time frame. The number of winning trades 169 is just lower than the number of losing trades 183 but in terms of net profit it’s incomparable. The largest winning trade has contributed to an amount of $ 62,212 with 4.63% of ES future price which itself is very promising. However, if one looks at the largest losing trade that has contributed to $ 13,500 which is 0.58% of the ES future price. The average winning trade accounts for $ 5,263 which is 0.53% of ES price as compared to average losing trade of $ 2,677 which is 0.27% of ES price.

E-MINI DOW ($5) FUTURES (SEP 2022): CBOT_MINI: YMU2022
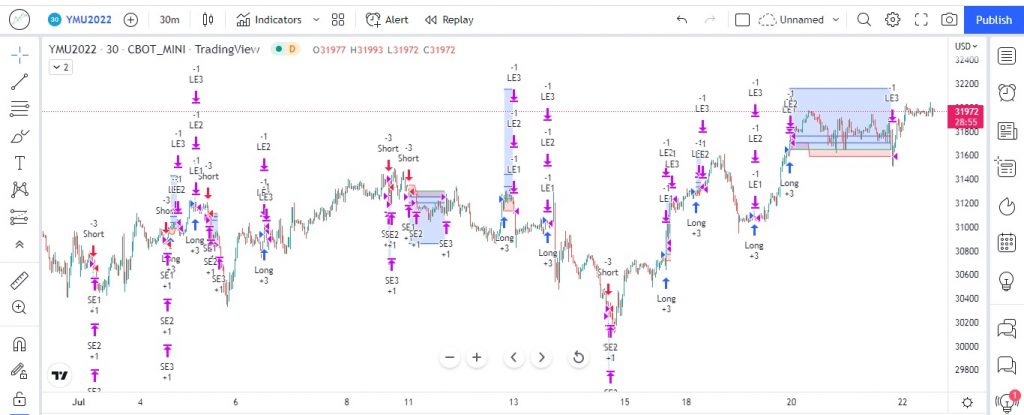
The below chart is of E-Mini Dow ($5) Futures for September 2022 contract on a 30 minutes time frame showing the performance of HFT ALPHA STRATEGY for the period of July 2022 with an initial capital of $ 1,00,000 and with risk of 1% of total capital being used.
Below chart shows the overview of YM for September future contract. As one can see the strategy has performed quite well and not well in terms of performance as compared to NQ & ES but still the net profit is near 1.99% which is $ 19,880 for a max draw down of just 0.56% which is $ 5,665 as on July 2022 with a profit factor of 1.691. The total trades that were executed are 208 with a % profitability of 40.87%.

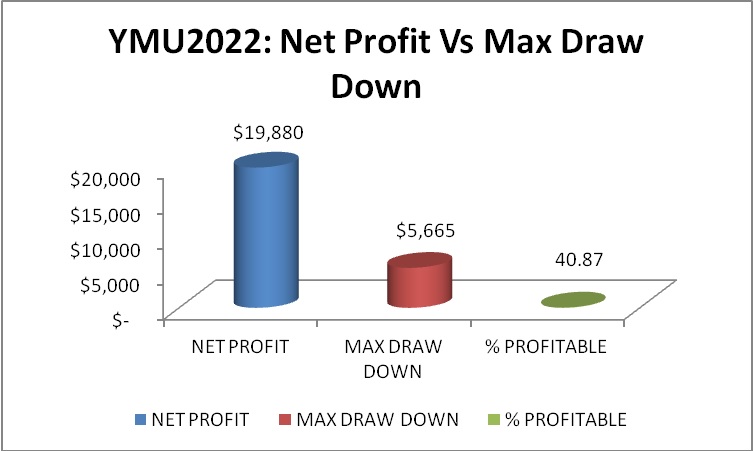
The above chart of YM for September 2022 future contracts explains the HFT ALPHA STRATEGY performance of Net profit vs Max draw down along with % of profitable on a 30 minutes time frame, excluding slippages and commission. The data is as of 22nd July 2022 downloaded from trading view with initial capital of $ 1,00,000 with risk % of 1.

The above screenshot explains the performance summary of YM (data taken from trading view). The number of winning trades to number of losing trades is almost equal unlike what we have seen in NQ & ES. The largest winning trade has contributed to $ 6,300 which is 3.94% of YM future price with largest losing trade has contributed to $ 1,060 with just 0.71%.
Website Disclaimer
The Articles published in Blog sections of HFT Solutions, is for educational purpose only and the author is not a SEC registered analyst. The views and opinions expressed on this website are solely those of the original author(s) and other contributor(s). These views and opinions do not necessarily represent those of HFT Solutions, the https://hftsolution.com/ staff, and /or any/all contributors to this site.
All information on the Site is provided in good faith, however we make no representation or warranty of any kind, express or implied, regarding the accuracy, adequacy, validity, reliability, availability, or completeness of any information on the site. UNDER NO CIRCUMSTANCE SHALL WE HAVE ANY LIABILITY TO YOU FOR ANY LOSS OR DAMAGE OF ANY KIND INCURRED AS A RESULT OF THE USE OF THE SITE OR RELIANCE ON ANY INFORMATION PROVIDED ON THE SITE. YOUR USE OF THE SITE AND YOUR RELIANCE ON ANY INFORMATION ON THE SITE IS SOLELY AT YOUR OWN RISK.