STRATEGY 01: GAP UP/DOWN -AS SOON AS GREEN OR RED CANDLE
Introducing HFT GAP UP/GAP DOWN STRATEGY a unique and one of the top performing strategy that is developed and owned by HFT Solutions Pvt. Ltd. Here in this strategy a client has an option to select multiple stop loss based on their risk appetite and target is usually the gap portion, that the price might fill based on different time frames. The strategy is run for top 100 US Stocks on trading view platform and selected only few stocks which has outperformed by this strategy, based on net profit and less drawdown. It is 100% non –repainting and signal generated are very accurate with very low stop loss and with a great rewards & has a profitable percentage of more than 55% (vary from stock to stocks).
Who can use this Strategy?
Well, a Novice trader to a professional trader can use the strategy without any extra effort. Just need to get access from HFT Solutions and add to your chart in Trading view and one can start trading either manually or by automating using BOT. The strategy also plots the entry, stop loss and exit on the chart (Position sizing on the chart on Trading view).
Can this Strategy works on every segments?
Yes, this strategy can be deployed on any stocks/Indexes/commodities/forex pairs/crypto etc. however, we have selected the performance on selected stocks on different time frames where it has performed quite well and one can make money on consistent basis.
Strategy Performance on selected TOP US Stocks on different time frames
The strategy can be traded automatically by connecting to client’s broker and also can be traded manually. Below are the details of the performance of the HFT GAP UP/GAP DOWN on different time frame for top performing US Stocks –top 10 stocks out of 100 stocks. (With Initial capital of $ 1,00,000, with Risk per trade of 1 percent):
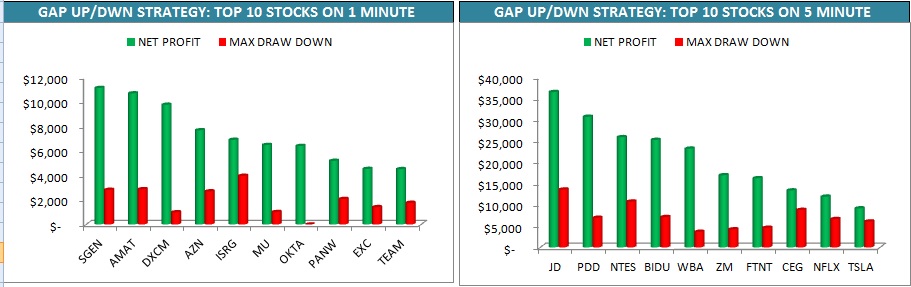
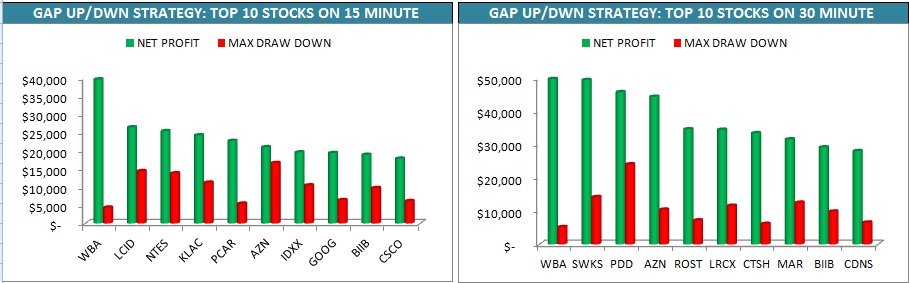
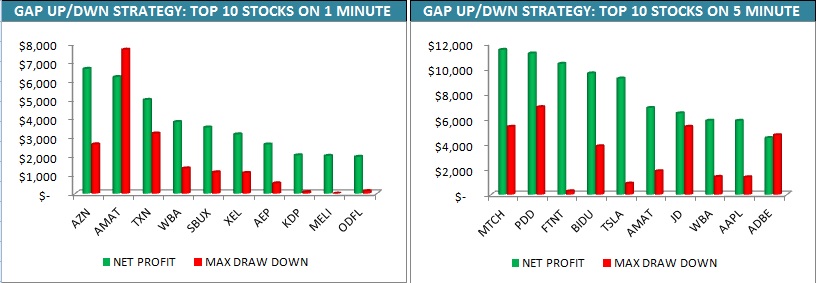
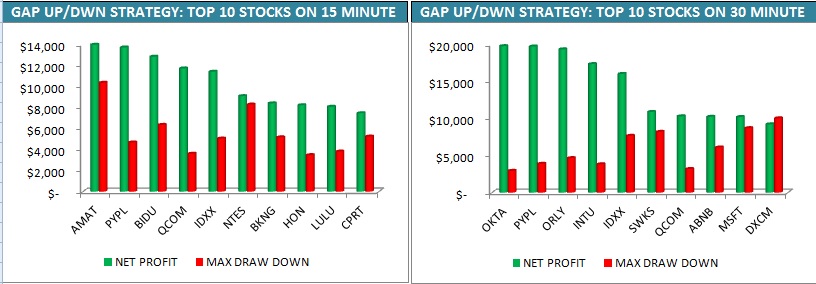
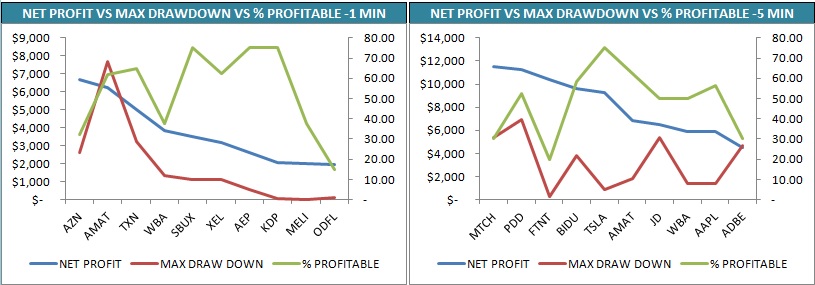
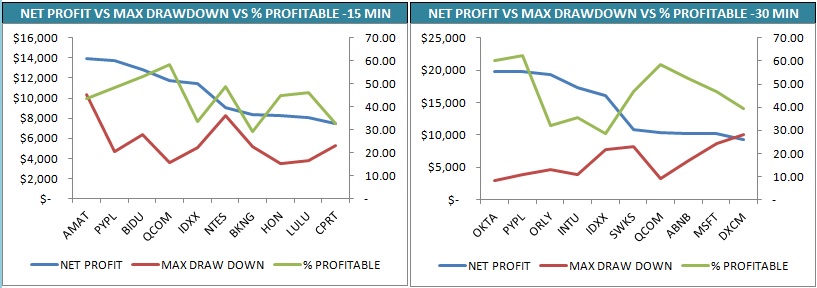
Below chart of HFT GAP UP/GAP DOWN STRATEGY shows NET PROFIT VS % of PROFITABLE on different time frames along with % of profitability.
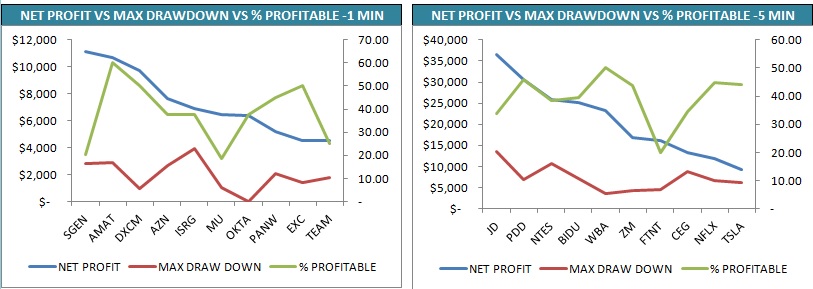
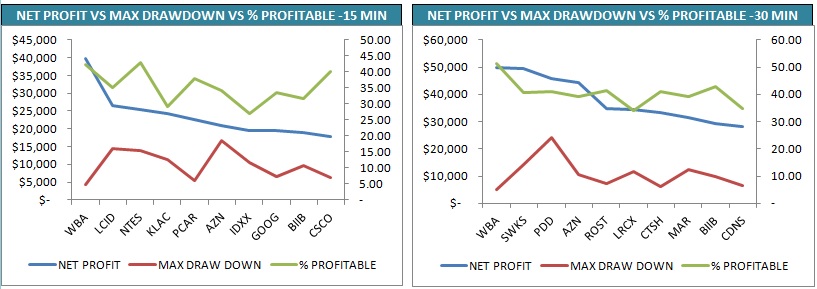
The above data is taken from trading view as on dated 26th July 2022 for different time frames. Please note the data may show a slight variation when testing by clients as the timing of running the BOT during our analysis may vary with the timings of the clients and the data may include new trading that has been executed. Let us see the performance by some of the top performing stocks:
WALGREENS BOOTS ALLIANCE, INC. (NASDAQ: WBA)
Below chart is of WALGREENS BOOTS ALLIANCE INC., on a 30 minute time frame with HFT GAP UP GAP DOWN Strategy plotted on the chart shows from dated 1st May 2022. As one can see the whenever the prices of WBA opens with gap up or gap down, the strategy looks for the bearish candle (on gap up) and bullish candle (on gap down) and when high/low is taken out the strategy opens a position with stop loss being placed at day’s low or high (the stop loss can be adjusted based on client’s preferences with intraday high/low or previous day high/low-up to 3 days max). The target is set to fill the gap and trade is closed when gap is closed or day ends. This helps the traders to take a trade with confidence and the quantity are calculated based on the risk taken which is 1% of total capital employed that is $ 1,00,000. The client has the opportunity to set risk in the input section based on their risk appetite.
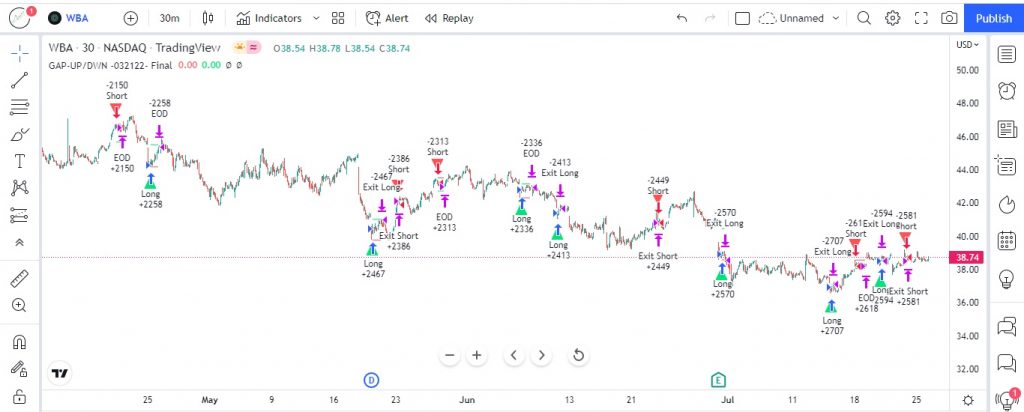
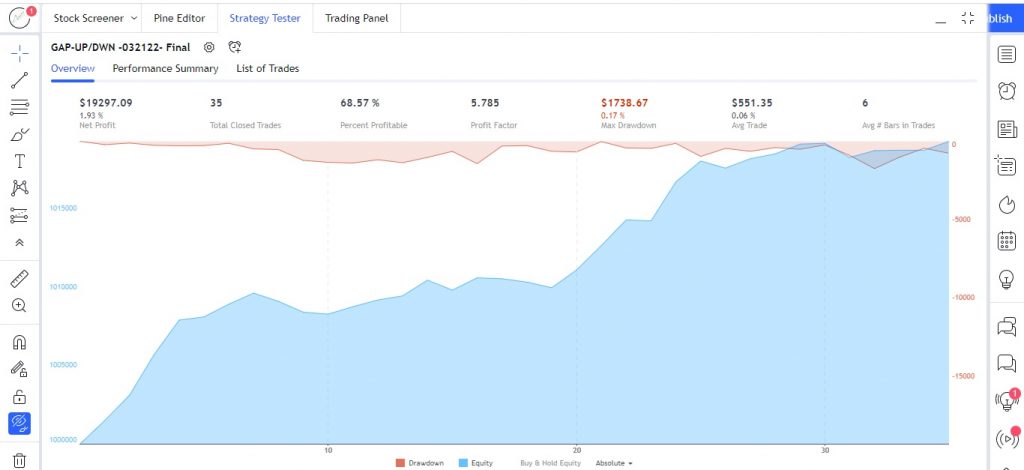
Below chart explain the WBA on a 30 minutes time frame with gap up /down strategy overview (Snapshot is taken from trading view). As one can clearly see the strategy has outperformed on a 30 minutes time frame with % of profitability of 68.57% which is quite high for any stock and with a profit factor of 5.785. The total closed trade on a 30 minutes time frame is 35 which means strategy executes only when there is a gap up /gap down provided open is greater than or less than previous high /low.
The net profit for the strategy is $ 19,297.09 which is 1.93% of total price movement of WBA on a 30 minutes time frame. The max drop down is around $ 1,738.67 which is quite low with a percentage of just 0.17% which makes this strategy one of the best to trade on 30 minute time frame. The average number of bars in a trade is around 6, which indicates the trade is closed in an average of max 6 bars.
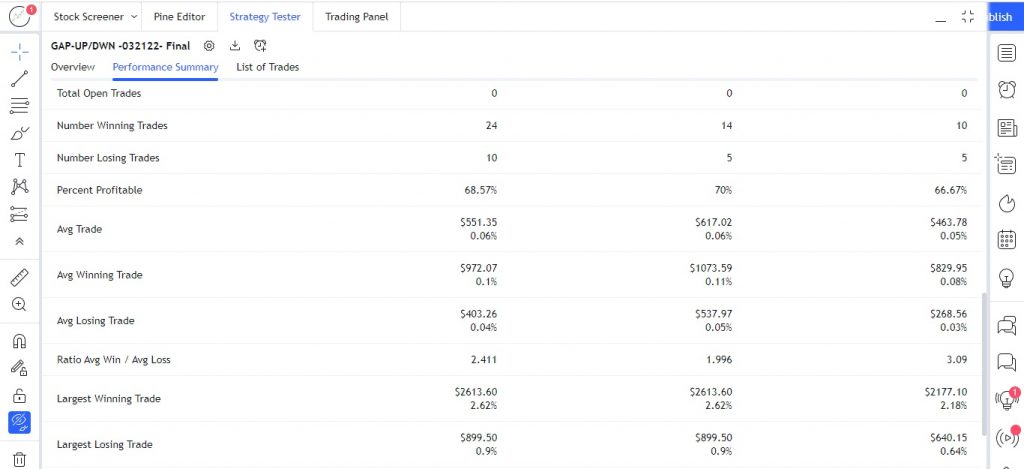
Below chart of WBA on 30 minutes time frame gives the glimpse of performance summary of the GAP UP/DOWN strategy as on dated 26th July 2022. As one can clearly see that the number of winning trades is around 24 and number of losing trade is just 10 which make this strategy with a percent profitable of 68.57% with an average trade of $ 551.35 (which is 0.06%) excluding the commission and slippages paid.
The average winning trade is about $ 972.07 with average losing trade of $ 403.26. The largest winning trade has contributed about $ 2,613.60 which is 2.62% as compared to largest losing trade of $ 899.50 which is about less than one percentage.
SKYWORKS SOLUTIONS, INC. (NASDAQ: SWKS)
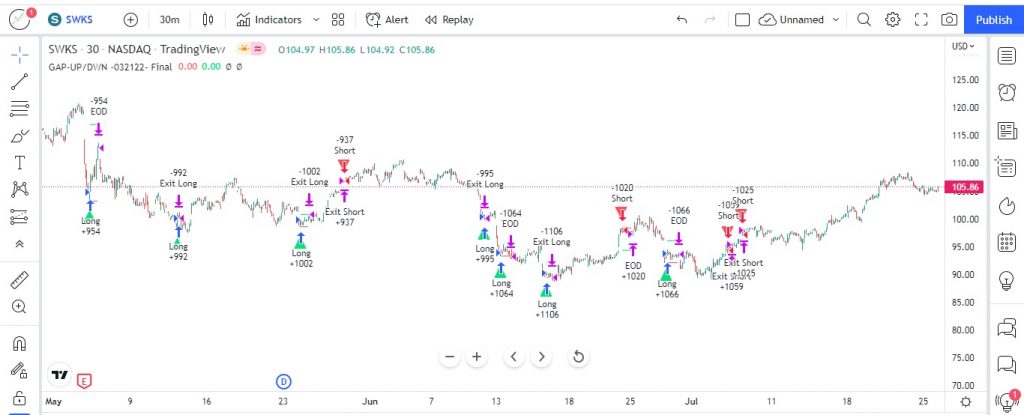
The below chart of SKYWORKS SOLUTIONS, INC. (SWKS) is plotted with GAP UP/DOWN Strategy on a 30 minutes time frame. As we have already mentioned for each segment the net profit to max draw down varies so does our strategy also. Here one can see that the performance of the strategy is 54.05% of profitability which means out of 100 trades the winning trade’s accounts to 54 numbers. The main advantage of this strategy is that in-spite of just above 54% of profitability the total net profit has increased that’s because of the very low stop loss and big profits. The chart explains the gap up/down positions on a 30 minutes with entry exit and stop loss being plotted on the chart. The client can select the stop loss based on their risk appetite and currently chart the capital employed is $ 1,00,000 with 1% of risk.
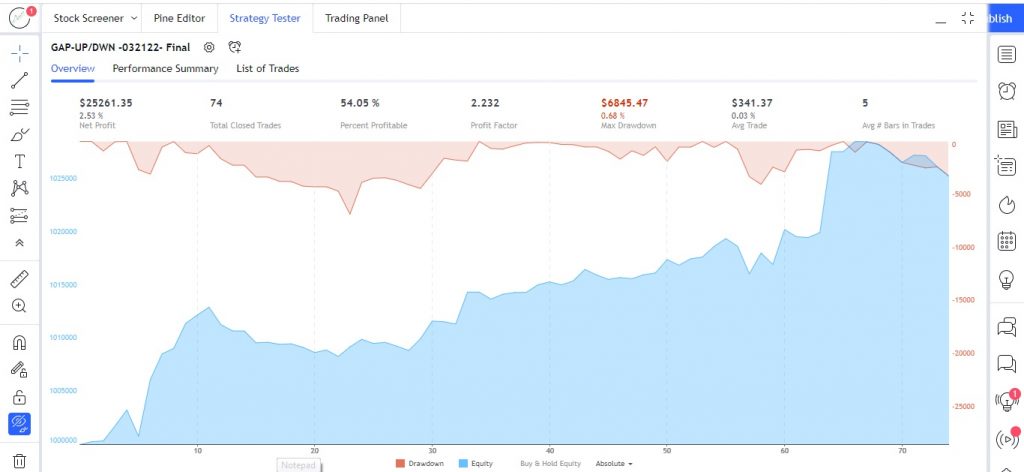
The above chart of SWKS on 30 minutes time frame shows the overview summary of the gap up/down strategy. The profitable % is at 54.05 which is just low as compared to previous stock but good enough to make money on the this stock as winning probability is high with adjustable risk factor (stop loss). The strategy on this stock has a profit factor of 2.232 which is quite good with average trade last for max of 5 bars. The total closed trades is 74 on a 30 minutes time frame as on 26th July 2022, with net profit of $ 25,261.35 with 2.53% which is quite impressive in itself as compared to max draw down of $ 6,845.47 with 0.68%.

The above chart of SWKS highlights the performance summary of the strategy. As one can see that the number of winning trades is 40 numbers as compared to number of losing trades of 31 as on 26th July 2022. This is the main reason why this strategy has outperformed in SWKS on a 30 minutes time frame with a percent profitability of 54.05%.
The average winning trade is $ 1,144.14 as compared to average losing trade of $ 661.42 with average trade at $ 341.37% which is 0.03%. the average wins / average loss ratio is at 1.73 which is quite good. The largest winning trade has accounted for $ 7,622.46 which is 7.62% which is outstanding performance in this stock as compared to largest losing trade which accounted only for $ 2,590.38 which is about 2.59%.
ASTRAZENECA PLC (NASDAQ: AZN)
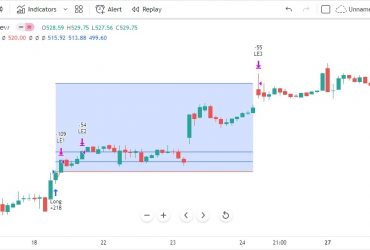
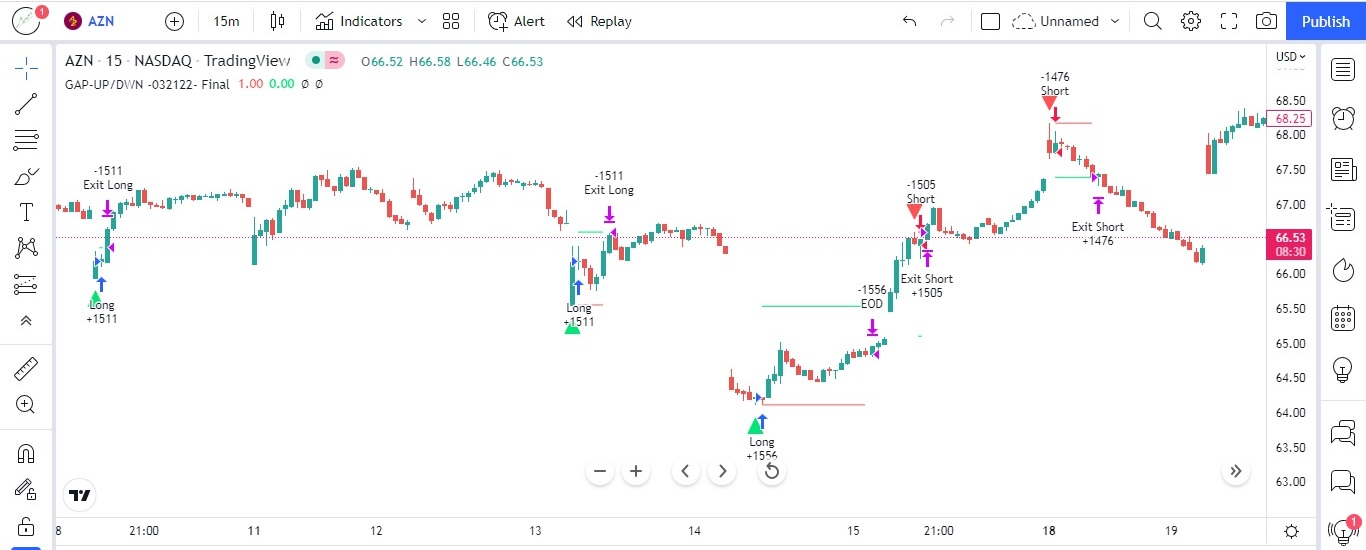
The below chart of ASTRAZENECA PLC (AZN) is plotted with HFT GAP UP/DOWN strategy on a 30 minutes time frame. The chart shows the various positions starting from July 2022.
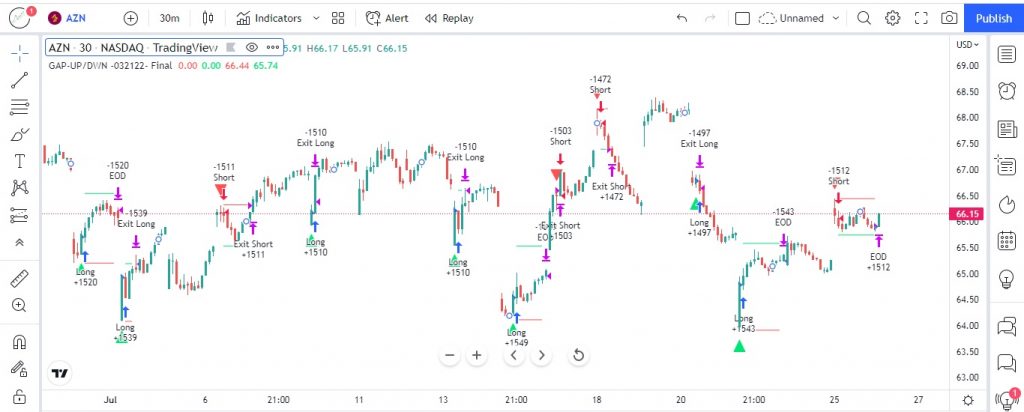
Below chart explains the strategy overview summary for gap up/down. The net profit for the AZN on 30 minutes is $ 15,593.40 which is 1.56%, as compared with very small draw down of 0.47% which is $ 4,801.86 excluding commission fees and slippages. The percent profitable is just above 51% which means for every 100 trades there is a probability of 51 times winning the trade with profit factor around 1.659.
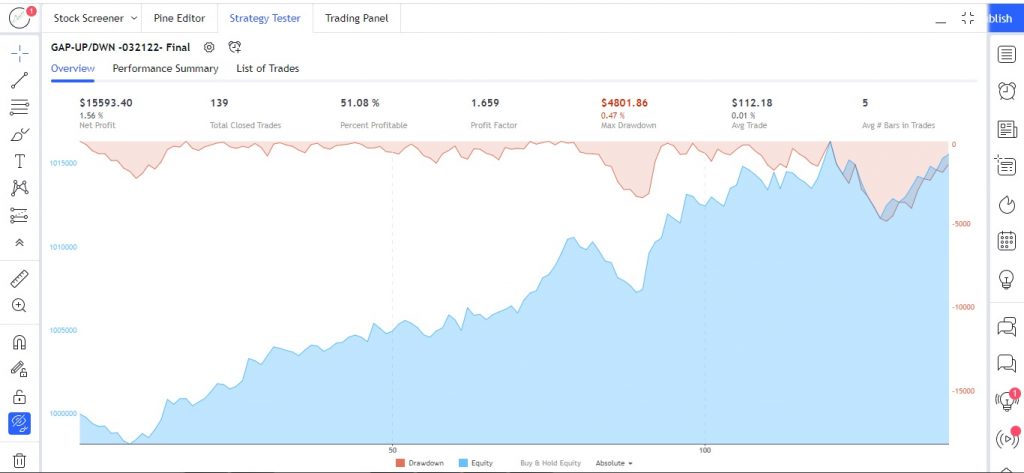

The above chart of AZN on 30 minutes explains the performance summary for the strategy as on 26th June 2022. The largest winning trade has accounted for $ 2,172.30 with 139 trades closed with a percentage of 2.17% as compared to largest losing trade which has accounted only for $ 1,365.76 with 1.37%.
STRATEGY 02: GAP UP/DOWN -1st CANDLE GREEN OR RED
HFT SOLUTIONS: GAP UP/DOWN 1ST CANDLE GREEN/RED STRATEGY PERFORMANCE ON SELECTED TOP US STOCKS:
Introducing HFT GAP UP /DOWN 1st candle green or red strategy, the second strategy similar to gap up /down that we have discussed earlier but the entry point is different from the other strategy. Here whenever the price opens a gap up/down and the strategy checks for the 1st candle in any timeframe for the green candle (on gap down) and red candle (on gap up) and if the condition satisfies on the next candle we take the entry and the stop loss is day’s high/low or the client has the option to set the stop loss even on previous days (up to 3 days max) with a target of previous close. The current strategy is for the initial capital of $ 1,00,000 with risk of 1% (one can change as per their needs). The strategy is run for top 100 US Stocks on trading view platform and selected only few stocks which has outperformed by this strategy, based on net profit and less drawdown. It is 100% non –repainting and signal generated are very accurate with very low stop loss and with a great rewards & has a profitable percentage of more than 55% (vary from stock to stocks).
Can this Strategy works on every segments?
Yes, this strategy can be deployed on any stocks/Indexes/commodities/forex pairs/crypto etc. however, we have selected the performance on selected stocks on different time frames where it has performed quite well and one can make money on consistent basis.
Strategy Performance on selected TOP US Stocks on different time frames The strategy can be traded automatically by connecting to client’s broker and also can be traded manually. Below are the details of the performance of the HFT GAP UP/GAP DOWN with 1st candle as green or red on different time frame for top performing US Stocks –top 10 stocks out of 100 stocks. (With Initial capital of $ 1,00,000, with Risk per trade of 1 percent):
Below chart of HFT GAP UP/GAP DOWN STRATEGY (1st Candle green or red) shows NET PROFIT VS % of PROFITABLE on different time frames along with % of profitability.
The above data is taken from trading view as on dated 27st July 2022 for different time frames. Please note the data may show a slight variation when testing by clients as the timing of running the BOT during our analysis may vary with the timings of the clients and the data may include new trading that has been executed. Let us see the performance by some of the top performing stocks:
OKTA, INC. (NASDAQ: OKTA)
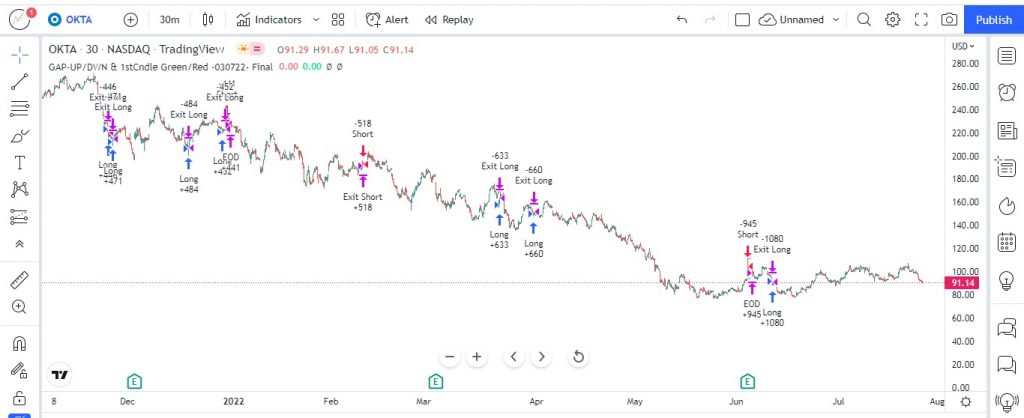
Below chart is of OKTA INC., on a 30 minute time frame with HFT GAP UP GAP DOWN with 1st Candle as Green or Red Strategy plotted on the chart shows from dated 1st Dec 2021. As one can see the whenever the prices of OKTA opens with gap up or gap down, the strategy checks the conditions for the bearish candle (on gap up) and bullish candle (on gap down) – on intraday basis with any time frame and when high/low is taken out the strategy opens a position with stop loss being placed at day’s low or high (the stop loss can be adjusted based on client’s preferences with intraday high/low or previous day high/low-up to 3 days max). The target is set to fill the gap and trade is closed when gap is closed or day ends. This helps the traders to take a trade with confidence and the quantity are calculated based on the risk taken which is 1% of total capital employed that is $ 1,00,000. The client has the opportunity to set risk in the input section based on their risk appetite.
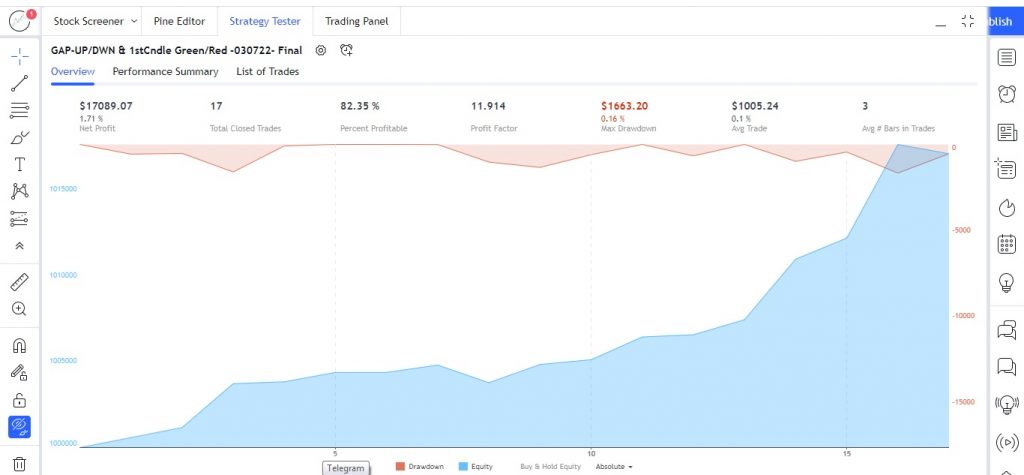
Below chart of OKTA INC is on a 30 minutes time frame plotted with gap up/down 1st candle green/red strategy showing the overview summary. As one can clearly see, the strategy has outperformed with highest percentage of profitable i.e., 82.35% which indicates, out of 100 trades 82 trades are winning trades and rest 18 are losing trades with profit factor of 11.914 which is really excellent for making money consistently. The net profit is around $ 17,089 with 1.71% for an overall draw down of $ 1,663.20 with 0.16% percent. The average trade last for only 3 bars which indicates how fast and with great accuracy the strategy performs. The above trades are reflecting as on dated 27th July 2022 with initial capital of $ 1,00,000 with risk of just 1% of total capital employed.
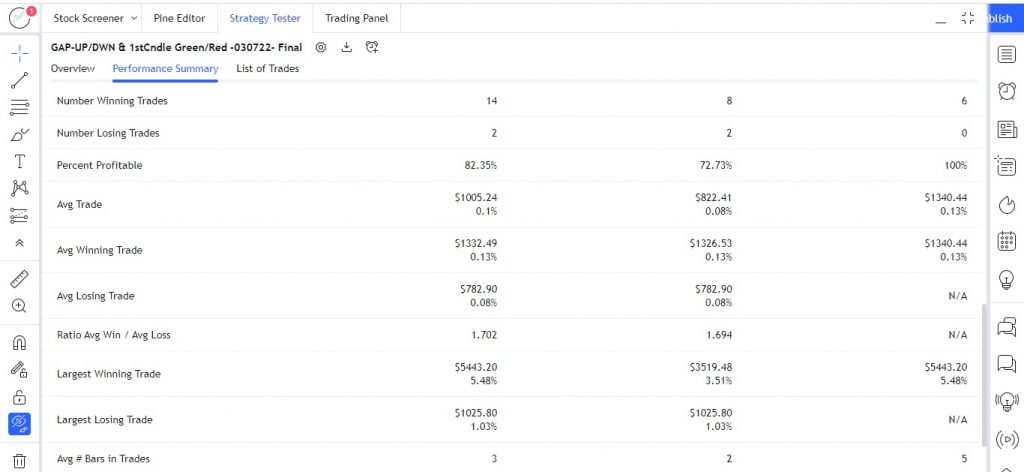
Below chart of OKTA INC is on a 30 minutes time frame plotted with gap up/down 1st candle green/red strategy showing the performance strategy in details.
The average winning trade contributed about $ 1,332.49 about 0.13% with average losing trade of $ 782.90 with 0.08%. The largest winning trade accounted for $ 5,443.20 with 5.48% which is quite high for any strategy with a largest losing trade which has accounted for only $ 1,025.80 with 1.03%.
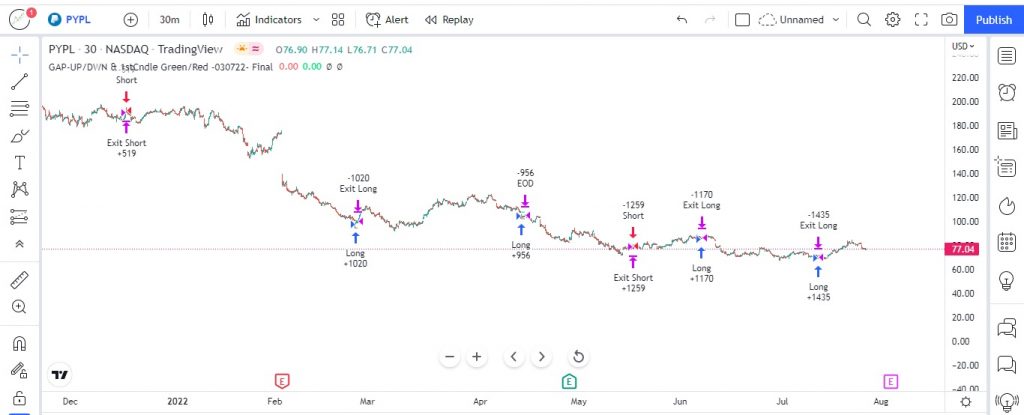
PAYPAL HOLDINGS, INC. (NASDAQ: PYPL)
The below chart explains the gap up /down with 1st candle as green/red strategy on a 30 minutes time frame starting from January 2022 till 27th July 2022 with an initial capital of $ 1,00,000 with a risk of 1%. Entry for the strategy is as soon as prices opens with a gap up /down the strategy looks for a green candle (in case of gap down) and for a red candle (in case of a gap up) on lower time frame and if condition is satisfied the next candle we enter the trade with an option for stop loss to place at either day’s low /high or previous day high /low (max up to 3 days) with a target being set at previous day’s high/low.
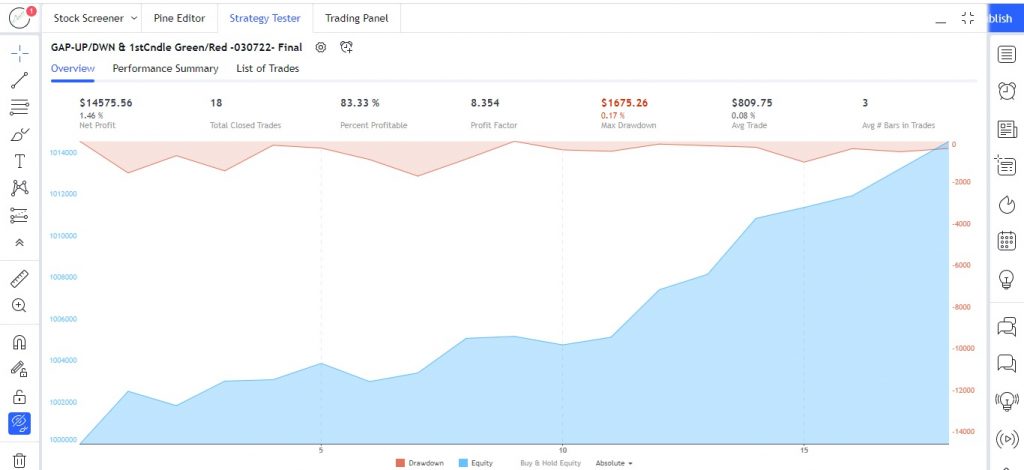
The below chart explains the gap up /down with 1st candle as green/red strategy on a 30 minutes time frame showing the overview summary. As one can clearly see the strategy has outperformed with a percent profitable of 83.33% which is quite very high (out of 100 trades for example 83 trades are of winning trades and rest are losing trades) with a profit factor of 8.354. The net profit for the strategy on a 30 minutes time frame is $ 14,575.56 which is about 1.46% and the max draw-down for the strategy is about $ 1,675.26 with 0.17% for a capital deployed of $ 1,00,000 with a risk factor of 1% of total capital employed. The strategy performance is as on dated 27th July 2022. The strategy performance of 83% winning rate is quite high as compared to other strategy which indicate the core strength of the strategy and the concept of executing this strategy in live market.
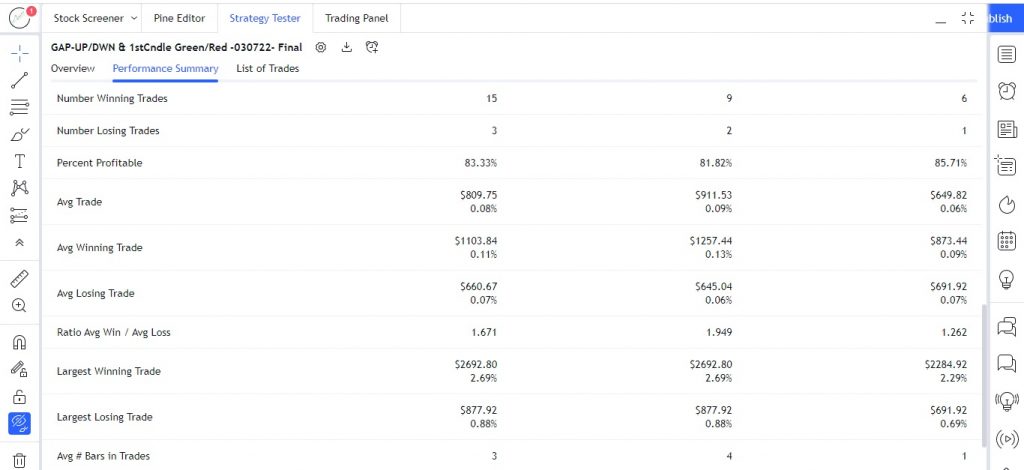
The below chart explains the gap up /down with 1st candle as green/red strategy on a 30 minutes time frame showing the performance summary in details (snap shot taken from trading view). The average winning trade has contributed for $ 1,1,03.84 which is about 0.11% as compared to average losing trade of $ 660.67 with 0.07%. the largest winning trade has accounted for $ 2,692.80 with 2.69% as percentage contribution and the largest losing trade has accounted for $ 877.92 which is 0.88% excluding commission fees and slippages.
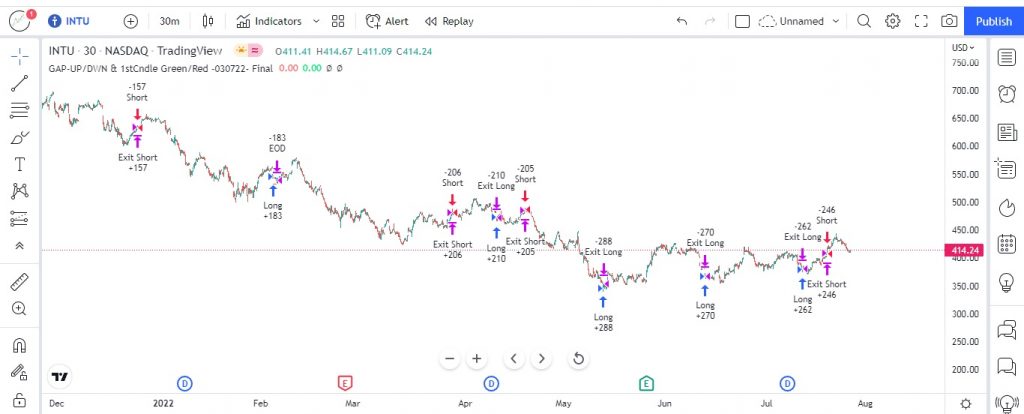
INTUIT INC. (NASDAQ: INTU)
The below chart explains the gap up /down with 1st candle as green/red strategy on a 30 minutes time frame starting from January 2022 till 27th July 2022 with an initial capital of $ 1,00,000 with a risk of 1% on the stock INTUIT INC (INTU). The entry, stop loss and targets are same as explained in the beginning of the blog.
The below chart explains the gap up /down with 1st candle as green/red strategy on a 30 minutes time frame showing the overview summary on INTUIT INC. The net profit for the stock is around $ 7,682.48 with 0.77%, where as max draw-down for the stock is $ 1,420.19 with 0.14% with profit factor of 2.696 and percent profitable around 47.62%.
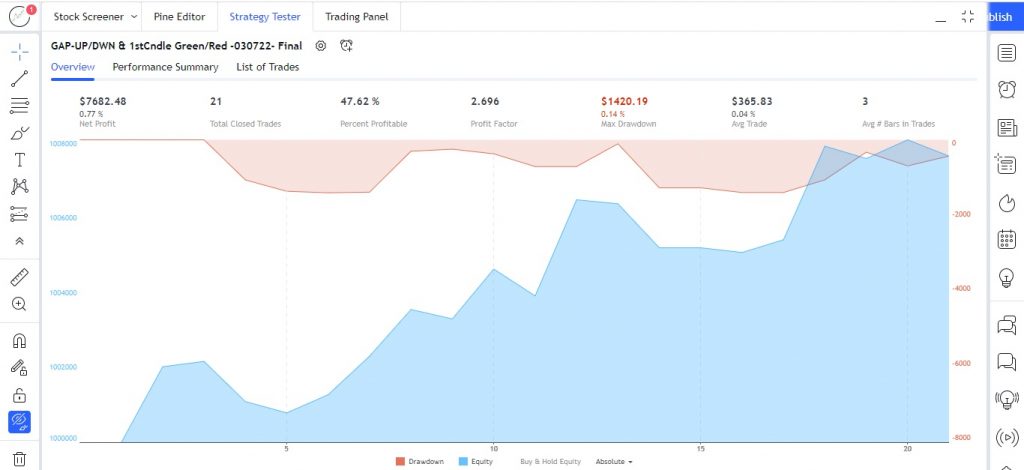

The above chart explains the gap up /down with 1st candle as green/red strategy on a 30 minutes time frame showing the performance summary in details (snap shot taken from trading view). The average winning trade has contributed for $ 1,221.17 with 0.12%. However, the largest winning trade has accounted for $ 2,576.07 with 2.59% as contribution. Also, the largest losing trade has contributed for $ 1,180.35 with 1.18% with a capital employed of $ 1,00,000 with 1% as max risk as on dated 27th July 2022.
Website Disclaimer
The Articles published in Blog sections of HFT Solutions, is for educational purpose only and the author is not a SEC registered analyst. The views and opinions expressed on this website are solely those of the original author(s) and other contributor(s). These views and opinions do not necessarily represent those of HFT Solutions, the https://hftsolution.com/ staff, and /or any/all contributors to this site.
All information on the Site is provided in good faith, however we make no representation or warranty of any kind, express or implied, regarding the accuracy, adequacy, validity, reliability, availability, or completeness of any information on the site. UNDER NO CIRCUMSTANCE SHALL WE HAVE ANY LIABILITY TO YOU FOR ANY LOSS OR DAMAGE OF ANY KIND INCURRED AS A RESULT OF THE USE OF THE SITE OR RELIANCE ON ANY INFORMATION PROVIDED ON THE SITE. YOUR USE OF THE SITE AND YOUR RELIANCE ON ANY INFORMATION ON THE SITE IS SOLELY AT YOUR OWN RISK.