Historical Reference-Example 01: Head & Shoulder Pattern on Dow Jones -30-CFD -4 Hrs Timeframe:
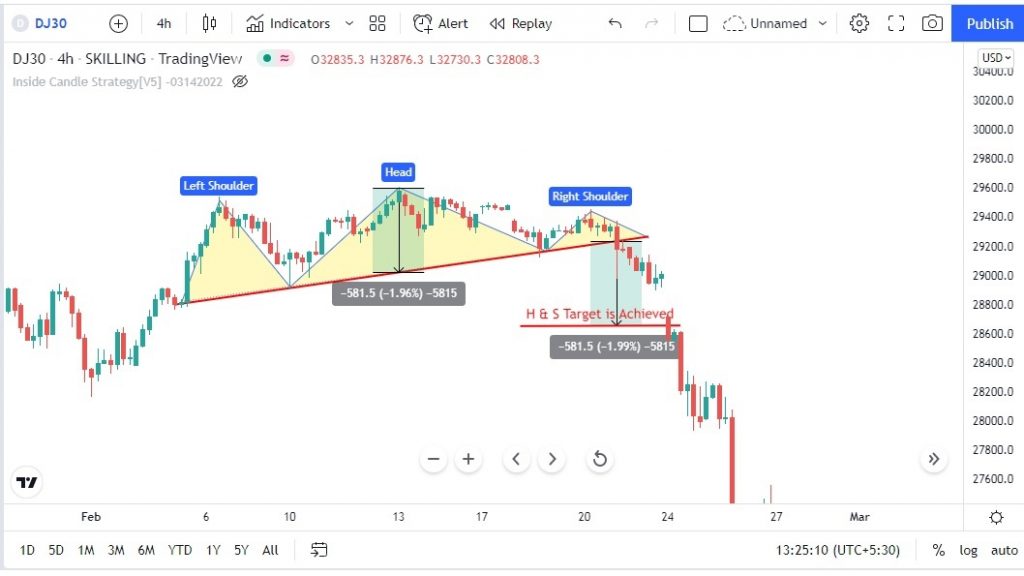
In the above example 1, we can clearly see the H&S formed on 4hrs timeframe for Dow Jones on February 2nd week 2020 when price was around 29,400. As soon as the neck line is broken it hit the target. Target is calculated by taking the distance from neck line to the high of head; here we can see the distance is 581.5. For profit it will be same distance from neckline minus 581.5 as shown in above example 1. Please note the H&S patterns may vary in size & appearance and is not 100% as shown in textbook. Here one can see left shoulder is nearly equals to head. In below example one can see the right shoulder is extended as compared to left shoulder. Both left and right shoulder must be less than head, which is the general criterion for H&S pattern detection.
Example 02: Head & Shoulder Pattern on Dow Jones -30-CFD -4 Hrs timeframe:
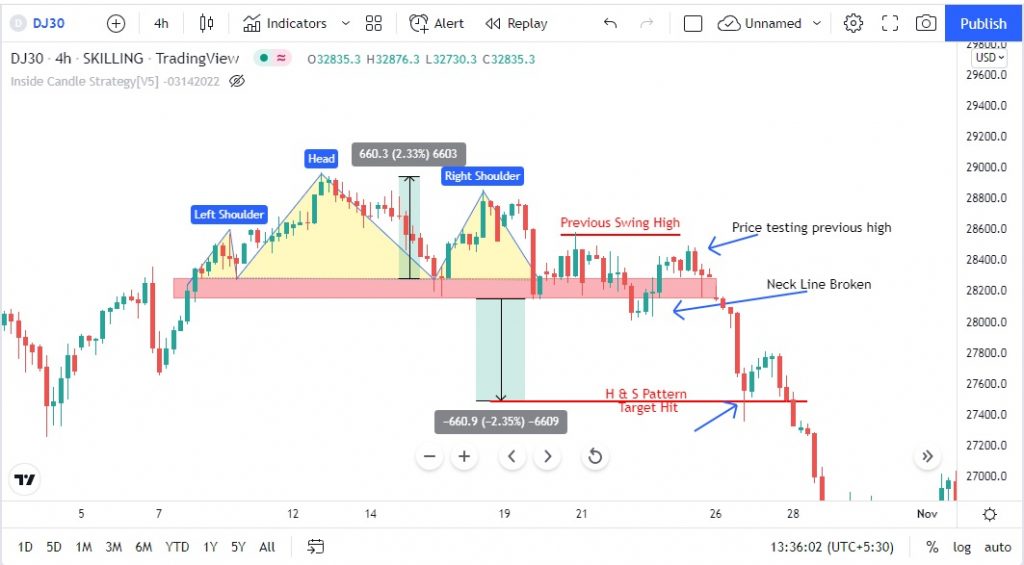
In above example 02, one can clearly see the right shoulder is greater than left shoulder. Another point to be noted here is when neck line is broken; prices may retest the previous levels swing high. Previous swing high is marked in red horizontal line and indeed price tested it and then finally hitting the target. The above H&S pattern occurred on 4hr timeframe of Dow Jones -30 –CFD on 19th October 2020.
Current Scenario -03-15-2022
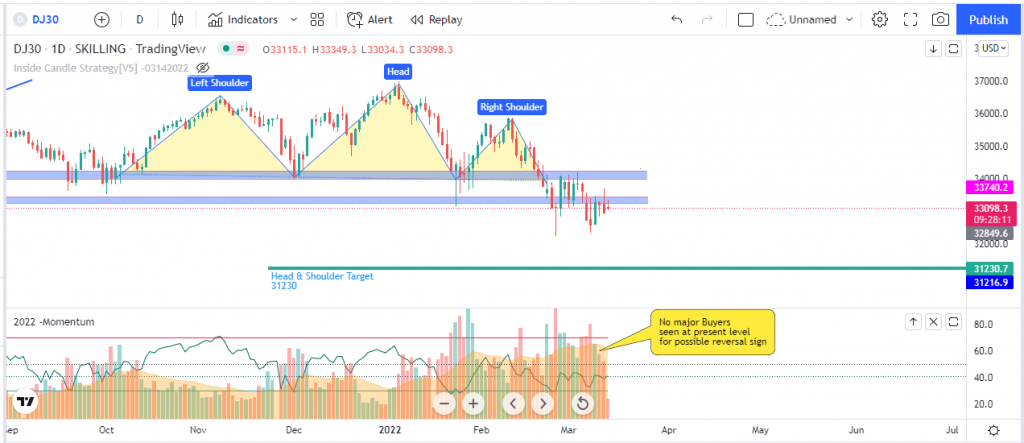
Dow Jones has formed the Head & Shoulder Pattern and has broken the neckline on a daily chart. Currently it is being tested at the higher prices. Also, at current level, there is a formation of double bottom, which is not a clear indication from the price perspective. We need to wait till we get proper setup with confirmation on daily and weekly charts. only then we can confirm the trend has changed from bullish to bearish.
Dow Jones 30 CFD Analysis: 06/21/2022
Starting this year 2022, inspite of breaking the major trend line the Dow Jones, again made an all time high of 36,970 on dated 05th January 2022. Most of the Investor or day traders were assuming the market will continue the rally. But, if one has observed what the price action was telling us, then we would know whether to buy at current levels when market was at its high time price. The below chart explains when trend line was broken (It was the 1st sign of weakness the bull trend is witnessed since the rally started on March 2020), there was hardly any fresh buy happening at higher levels. It took 10 months for market to make a price action of Head & Shoulder (please note, the Head & Shoulder pattern occurs when market is at its peak level or all time high). Last time when we analyzed on a daily time frame there was a head & shoulder pattern that has occurred. Now, this can also be confirmed even on the weekly time frame. When neck line was broken in a daily chart the prices retested the right shoulder which was our major pivot by spending few couple of weeks and we finally got the confirmation on the weekly chart with a rejection candle. please, see the below chart for rejection candle on weekly time frame.
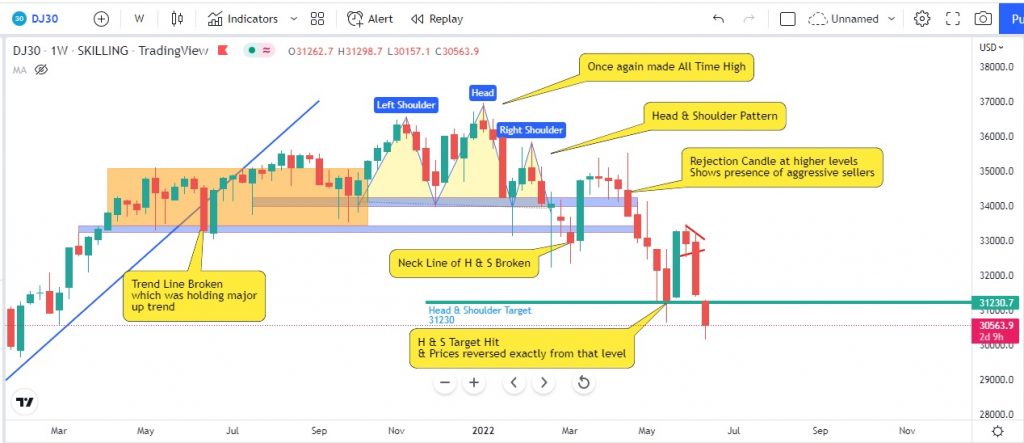
When the neckline of the Head & shoulder pattern is broken (see above chart), prices retested the higher levels and formed a rejection candle and prices started to move towards the target and one can see in the chart the price hit the target of Head & Shoulder pattern of 31,230 and the very next candle there was a reversal (or profit booking).
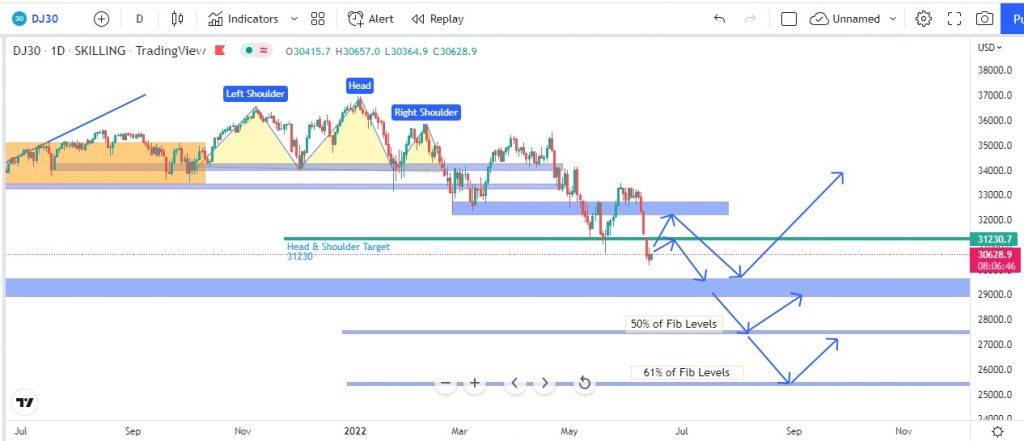
So, far we have seen when a major trend line is broken, we were able to see the sign of weakness on a weekly chart, and then the prices went in a consolidation phase and that is where it has created a head & shoulder pattern and now the market has reversed from bullish to bearish. At present if we see there is a fall of 33% of Fib levels. Now the question arises is will the market will crash further or will it reverse. At present because of fed meeting to be held on 06/15/22. The market may show a small bounce back as it has already hit the 33% of Fib levels. Strong buying can be seen at 50 to 60% of Fib levels, (we have not yet reached those levels at present). But it may not happen in one go. Market will take time, and also there has to be a time correction which is due in the market. As of now, definitely, the market is in a downtrend phase.
Current Scenario: 06/21/2022
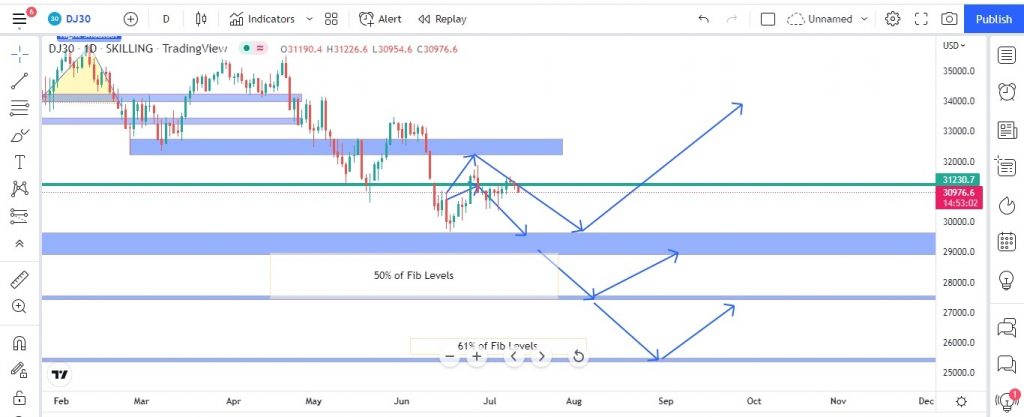
Since there is a FED Meeting, one can expect a bounce at current levels (33% of Fibo levels). The possible scenarios are explained in the below chart. The strong buy may come at 50 to 61.8% of Fibo levels, also it is the strong support zone and buyers will be more interested at that levels, provided one has to get the confirmation at that level. Note there is a pending of time correction in the market. Market may not go up in a straight line nor does it go down in a straight line. For every impulse wave there will be a correction, one correction will be price correction and another will be time correction, only after that market will set a new direction.
DOW JONES 30 CFD: UPDATES AS ON 12th JULY 2022
In our last analysis we have mentioned the key support and resistance level for Dow Jones 30 CFD on a daily time frame. Also, the prices of Dow Jones 30 CFD were trading around 33% of Fibo levels (Fibo drawn from 2020 low to high of 2022. We also mentioned that there may be a buy at 51% & 61% of Fibo levels. At present, Dow Jones is trading in a consolidation phase also there is a major inflation data coming out on July 13th 2022. The market may show some volatility and there is a high change to hit the stop loss on both side. So traders must wait for a clear direction and must trade only on confirmation with strict stop loss. Let us see, how Dow Jones has performed as per our analysis that was shared in our blog.
Dow Jones prices are being following near exactly to what the blue line is represented. The prices of Dow Jones bounced before the hitting the level of 50% of Fibo levels and it retested the 32,000 and the prices got a strong resistance before hitting 32,000 levels (made high of 31,882). Below chart shows the Dow Jones 30 CFD on a daily time frame.
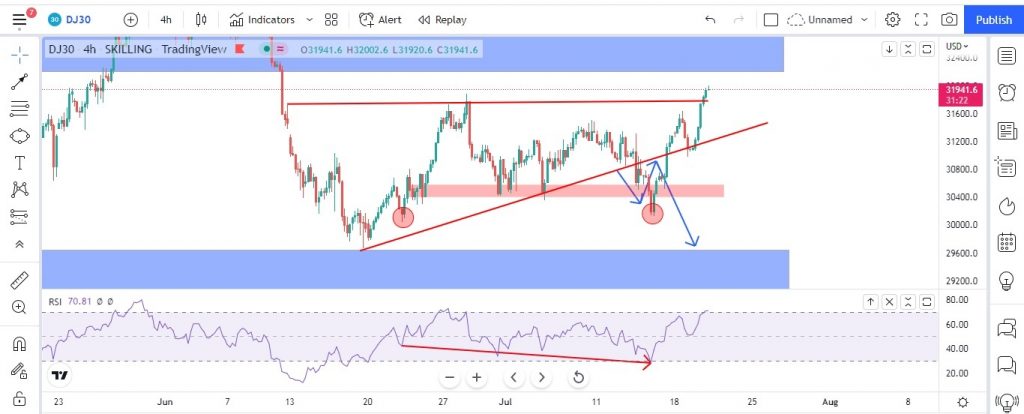
The below chart of Dow Jones is on a 4 hours time frame and one can clearly see the prices of Dow Jones are presently trading in a triangle pattern and breakout of prices above or below the pattern we may get the confirmation about the possible price action movement along with clear direction. We have also included Fibo ratio of latest swing high and swing low and prices of Dow Jones are currently trading near 33% of Fibo. The major support would be just below the 23% where prices took multiple supports and also note if price breaks the 23% of Fibo levels the price may retest the last low and can head towards the 50% of Fibo levels which is around 27,632 levels. The below red color trend line is holding the prices of Dow Jones, any violation of the prices and trading below the trend line will make it more weak and the prices may once again enter in the territory of bear market.
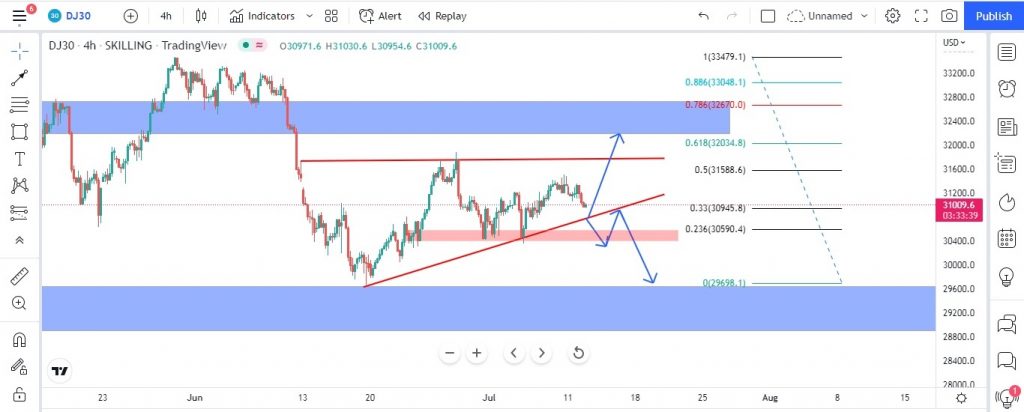
The blue arrow indicates the possible price action movement that is possible in Dow Jones 30 CDS in the coming days.
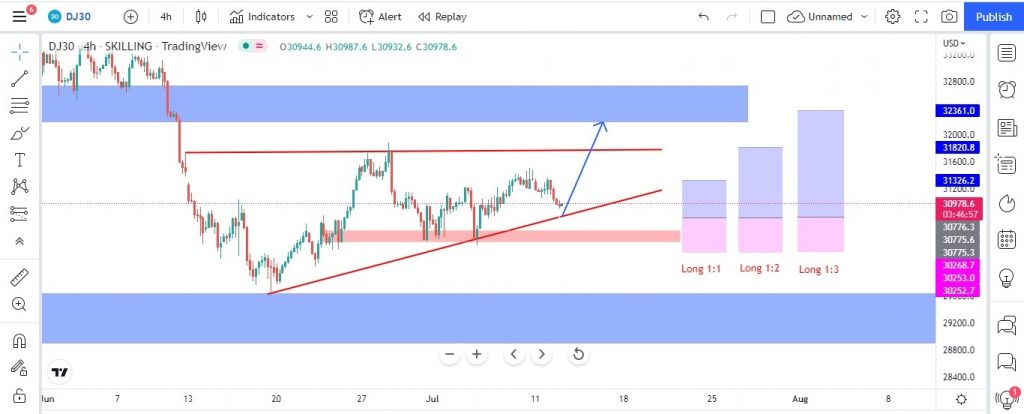
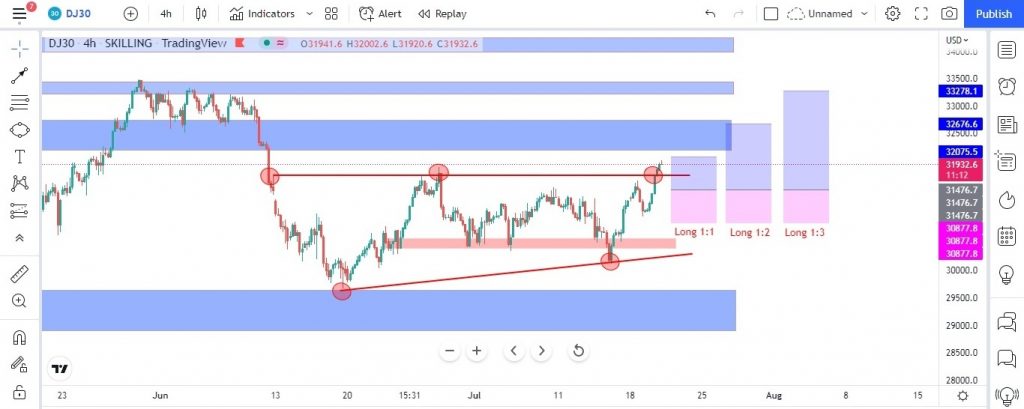
The below chart of Dow Jones explains the long position with risk to reward ratio set ups on a 4 hours time frame at current market price (CMP)-31,000
- BUY SET UP 1: Buy at -30,775 with stop loss at 30,246 with target of 1:1 or 31,326.
- BUY SET UP 2: Buy at -30,775 with stop loss at 30,246, with target of 1:2 or 31,820.
- BUY SET UP 3: Buy at -30,775 with stop loss at 30,246, with target of 1:3 or 32,361.
Please, note the above buy set up is given since risk to reward ratio is good at current levels & 31,000 can also act as psychological level below which one can enter at 30,775 levels & also prices of Dow Jones 30 CFD is currently trading at the lower trend line (possibility of a bounce to retest the upper trend line). RSI is also indicating that the price at current level is trading at 45 levels.
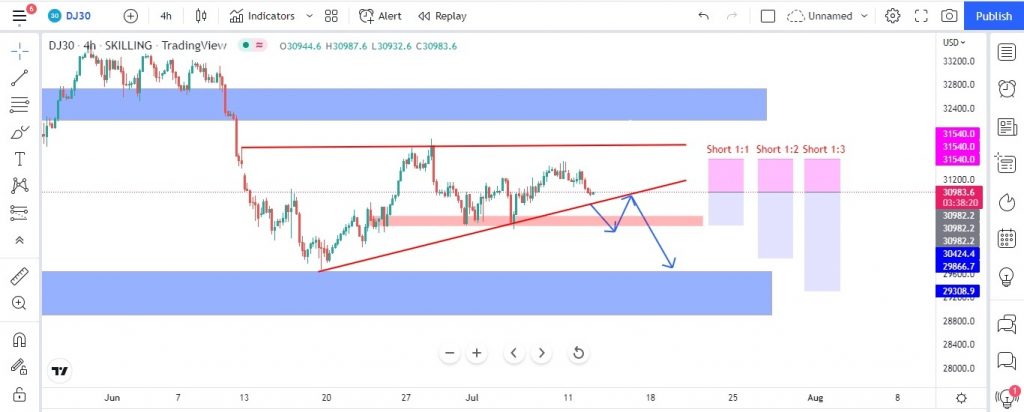
Below chart of Dow Jones is also on a 4 hours time frame with Short set up at current market price (CMP)-31,000.
- SELL SET UP 1: Sell at -30,985 with stop loss at 31,540 with target of 1:1 or 30,426.
- SELL SET UP 2: Sell at -30,985 with stop loss at 31,540 with target of 1:2 or 29,868.
- SELL SET UP 3: Sell at -30,985 with stop loss at 31,540 with target of 1:3 or 29,322.
One must go for sell set up on when prices of Dow Jones breaks the below trend line and only after the prices retest the below trend line and with volume confirmation (see the blue arrow for sell set up entry).
DOW JONES 30 CFD: UPDATES AS ON 20th JULY 2022
As per our last analysis done on 12th July we have mentioned the sell setup with entry at $ 30,985 with stop loss at $ 31,540 the prices of Dow Jones have hit target of 1:1 and even it hit 1:1.5 or $ 30,127 before hitting our trailing stop loss. Below is the updated chart of Dow Jones on lower time frame of 1 hour.
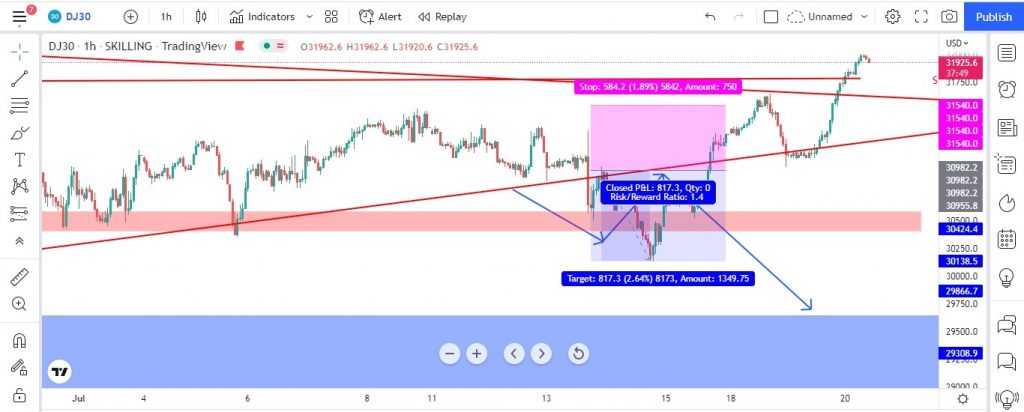
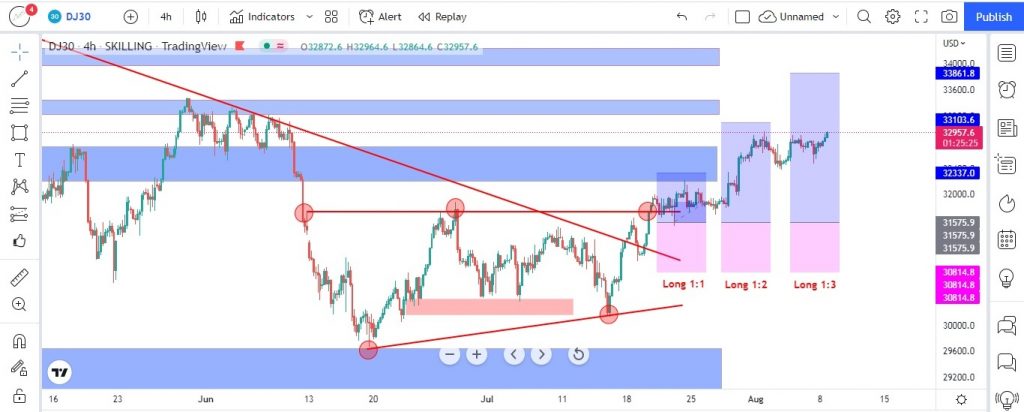
Below chart of Dow Jones on 4 hour time frame explains why the breakdown of triangle pattern failed. The reason is when prices made a new low by giving false breakdown, the RSI made a hidden bullish divergence (see below RSI chart showing hidden bullish divergence with red color arrow) & prices reversed from that low point of $30,127.
The above chart of Dow Jones explains the long position with risk to reward ratio set up on a 4 hours time frame, the details are as follows:
- BUY SET UP 1: Buy at – $ 31,476 with stop loss at $ 30,877 with target of 1:1 or $ 32,076.
- BUY SET UP 2: Buy at -$ 31,476 with stop loss at $ 30,877, with target of 1:2 or $ 32,676.
- BUY SET UP 3: Buy at -$ 31,476 with stop loss at $ 30,877, with target of 1:3 or $ 33,278.
DOW JONES 30 CFD: UPDATES AS ON 8th August 2022:
As per our last analysis on dated 20th July we have suggest for a buy at level $ 31,476 to $ 31,576 with stop loss at $ 30,877 with target of 1:1 or $ 32,076 and with target of 1:2 or $ 32,676 and with target of 1:3 or $ 33,278. Currently as on 8th August the prices of Dow Jones are trading at $ 32,958. The prices have hit the 1st target and one can book 50% of their position and trail their stop loss to entry which is at $ 31,576. Once it hit the second target one can book rest 25% and trail their stop loss at $ 32,076 till target 3 is reached which is at $ 33,278.
Below is the updated chart of DJ30 on 4 hours time frame showing the performance of the buy set up given on 20th July 2022.
Website Disclaimer
The Articles published in Blog sections of HFT Solutions, is for educational purpose only and the author is not a SEC registered analyst. The views and opinions expressed on this website are solely those of the original author(s) and other contributor(s). These views and opinions do not necessarily represent those of HFT Solutions, the https://hftsolution.com/ staff, and /or any/all contributors to this site.
All information on the Site is provided in good faith, however we make no representation or warranty of any kind, express or implied, regarding the accuracy, adequacy, validity, reliability, availability, or completeness of any information on the site. UNDER NO CIRCUMSTANCE SHALL WE HAVE ANY LIABILITY TO YOU FOR ANY LOSS OR DAMAGE OF ANY KIND INCURRED AS A RESULT OF THE USE OF THE SITE OR RELIANCE ON ANY INFORMATION PROVIDED ON THE SITE. YOUR USE OF THE SITE AND YOUR RELIANCE ON ANY INFORMATION ON THE SITE IS SOLELY AT YOUR OWN RISK.