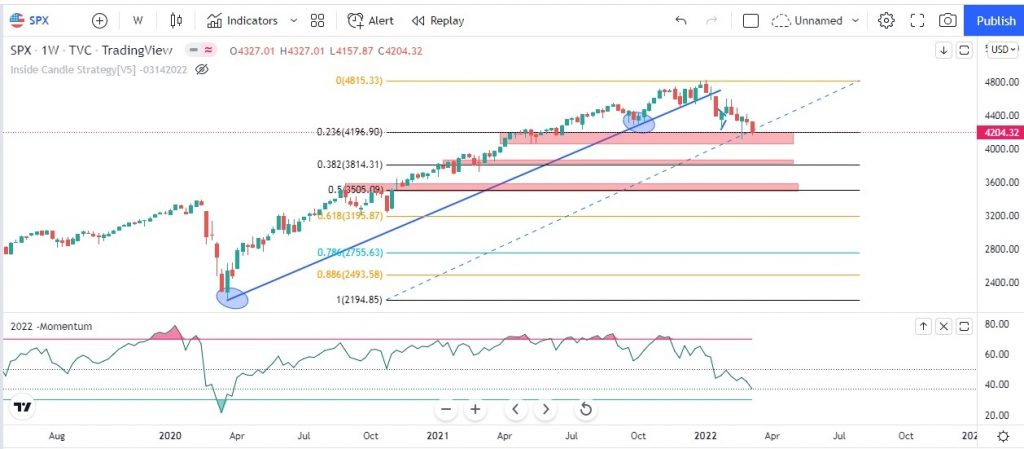
S&P 500 has broken the major trend line which started on 23rd march 2020. Currently, it is taking support at 23.6% of Fibo., levels, if broken it can test 3814 (38.2% of Fibo) and 3505 (51% of Fibo) of fibonacci levels. Levels are shown in the above chart. RSI is just above 40 levels, below which it will be more bearish until further confirmation.
S&P 500: 06/21/2022- Analysis
The above chart with analysis was shared on March 15, at that time the S& P was trading at 4,204 levels, at present we can see the market continued to rally from 0.236 to 0.33 of Fibo, & is currently heading towards the 0.50 of Fibo, levels. One can see a strong buying happening if the price reaches the 0.51 of Fibo levels, for which we need confirmation.

From the above chart one can see that price after breaking the 23% of Fibo levels; it also broke the 33% of Fibo, which indicates currently there is a strong downtrend. When the price broke the major trend line, did we know that market is going to bearish from strong bullish trend? Definitely, yes to this question. When major trend line was violated the prices took support at the 23% of the Fibo levels, from there again the price tried to make a new high, but was failed, since the violation of trend line, indicates the weakness in a stock. The prices tried to make a new high, but failed to do. By doing this the price action indicated something else, i.e., it has formed a Head & Shoulder at the top. Below chart shows the Head & Shoulder pattern which has occurred when prices were at all time high.

From the above chart we can clearly see that there was a H & S pattern which has formed and we got confirmation when market broke the neck line of the H & S pattern, that the market is in downtrend. Now, when we know that market has changed the trend from bullish to bearish, the next question arises is how do we enter and at what price we need to go short? For this question, please, see the chart. In the chart it is clear that when price broke the neckline, the prices retested the neckline and spent few days in the red zone. Let’s look at exactly what has happened in the red zone in a lower time frame.
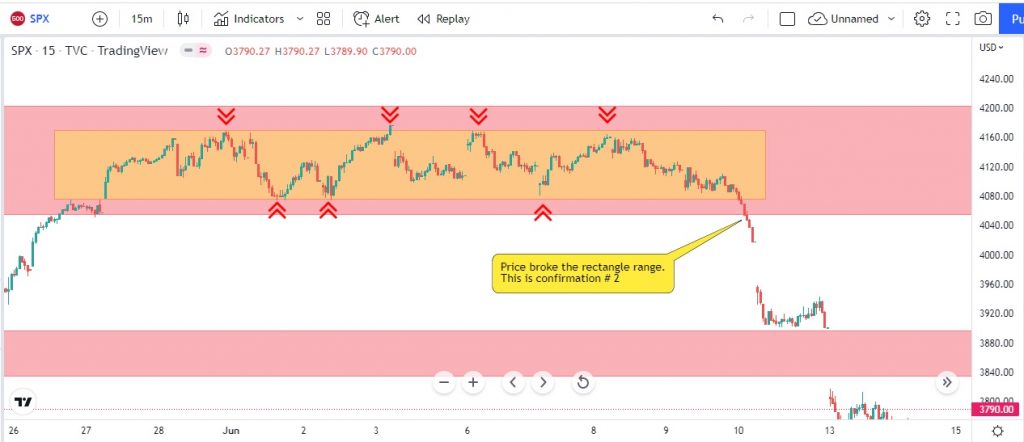
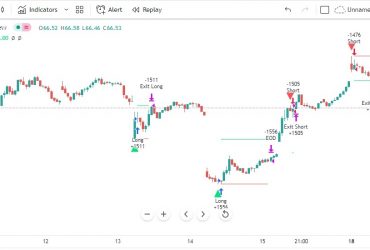
One can clearly see that in the red zone, if we look in lower timeframe of 15 minutes, the prices consolidated in a rectangle range and finally broke the lower range, which is the entry for short position and the stop loss would be just above the rectangle range. The targets based on position sizing will be 1:1 or 1:2. In the below figure, both 1:1 and 1:2 has been achieved.
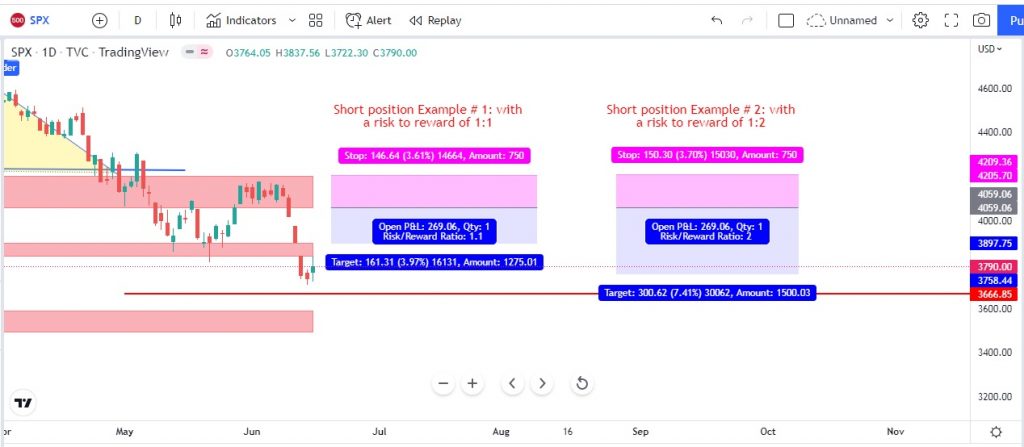
S&P 500 -CFD: UPDATES AS ON 12th JULY 2022
In our previous update on S&P 500 CFD analysis we mentioned that the prices has formed the Head & Shoulder pattern and target was 3,666 (red line) and which was achieved on 16th June and prices exactly reversed from that level on a daily time frame. The below chart is the updated chart of S&P 500 –CFD on a daily time frame with price action as on 12th July 2022.

At present the prices of S&P 500 is trading in a consolidation phase also there is a major inflation data coming out on July 13th 2022. The market may show some volatility and there is a high change to hit the stop loss on both side. So traders must wait for a clear direction and must trade only on confirmation with strict stop loss.
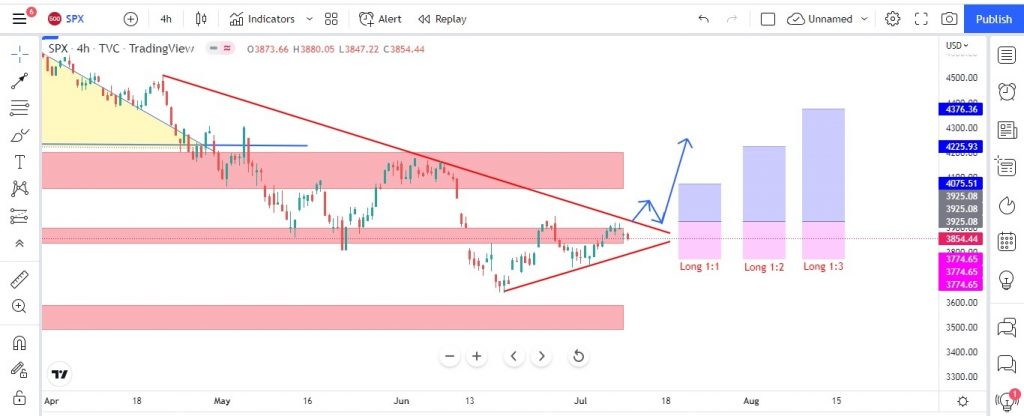
The above chart of S&P 500 CFD is on a 4 hours time frame, showing buy set up with proper risk to reward ratios, the details are as follows:
- BUY SETUP 1: Buy at 3,925 only when price breakout upper trend line and retraces back to 3,925 levels with stop loss placed at 3,745 with a risk to reward ratio of 1:1 or 4,075.
- BUY SETUP 2: Buy at 3,925 only when price breakout upper trend line and retraces back to 3,925 levels with stop loss placed at 3,745 with a risk to reward ratio of 1:2 or 4,226.
- BUY SETUP 3: Buy at 3,925 only when price breakout upper trend line and retraces back to 3,925 levels with stop loss placed at 3,745 with a risk to reward ratio of 1:3 or 4,376.
One can place a buy order when price gives a breakout above the trend line with good volume confirmation on a 4 hours time frame and wait for the pullback when price tries to retest the level of 3,925 and only then one can initiate a buy order. Since, this is a risky trade as we are in downtrend and the breakout above the trend line will be the 1st test on the buy side in a down ward trend. Also, if price move as per the view only then start to trail the stop loss and maintain a strict stop loss.
The below chart of S&P 500 CFD is on a 4 hours time frame with short setup, the details are as follows:
- SELL SETUP 1: Sell at 3,798 only when price give breakdown on lower trend line and enter at pullback with stop loss placed above 3,931 with a risk to reward ratio of 1:1 or 3,666.
- SELL SETUP 2: Sell at 3,798 only when price give breakdown on lower trend line and enter at pullback with stop loss placed above 3,931 with a risk to reward ratio of 1:2 or 3,533.
- SELL SETUP 3: Sell at 3,798 only when price give breakdown on lower trend line and enter at pullback with stop loss placed above 3,931 with a risk to reward ratio of 1:3 or 3,402.
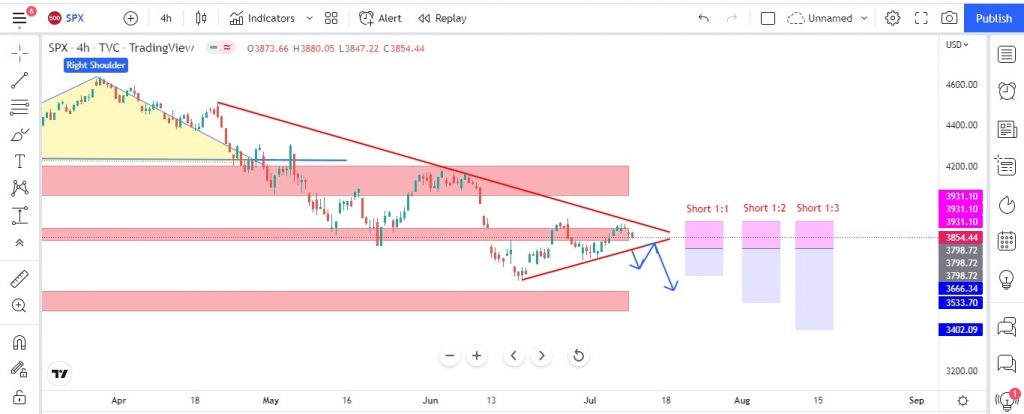
One can place a sell order when price gives a breakdown below the trend line with good volume confirmation on a 4 hours time frame and wait for the pullback when price tries to retest the level of 3,798 and only then one can initiate a sell order. The sell setup is based only on confirmation and also we are trading with the main trend. Also, if price move as per the view only then start to trail the stop loss and maintain a strict stop loss.
S&P 500 -CFD: UPDATES AS ON 20th JULY 2022
As updated in our last analysis on 12th July, the prices of S&P 500 has triggered our sell setup by giving a false breakdown and hit out stop loss. Also, there was an Inflation data that came on 13th July made the prices more volatile which was already mentioned in our last analysis. After hitting our stop loss on sell side now the prices of S&P 500 have triggered our buy setup. Below chart explains the failure of sell setup with RSI hidden bullish divergence on a 4 hours time frame shown in red arrow.
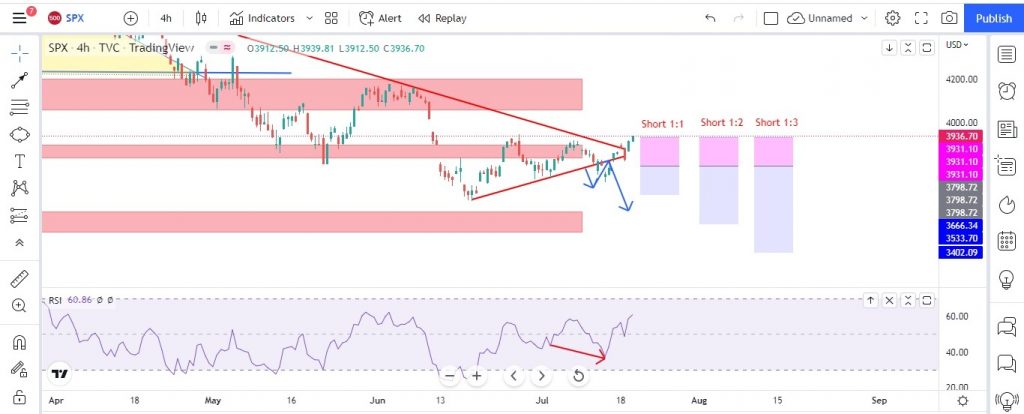
The below chart of S&P 500 is on a 4 hours time frame which has triggered our buy set up at $ 3,925 and also it has also broken the above red trend line which was keeping the prices in downtrend since 21st April 2022. Also, RSI is just above level of 60 which is indicating that prices may head towards the level of 70 since it has already trapped the sellers by making a hidden bullish divergence. The modified buy set up with stop loss and targets are as follows: (Note only targets have been modified since there is a major pivot at $ 4,170) which needs to be tested.
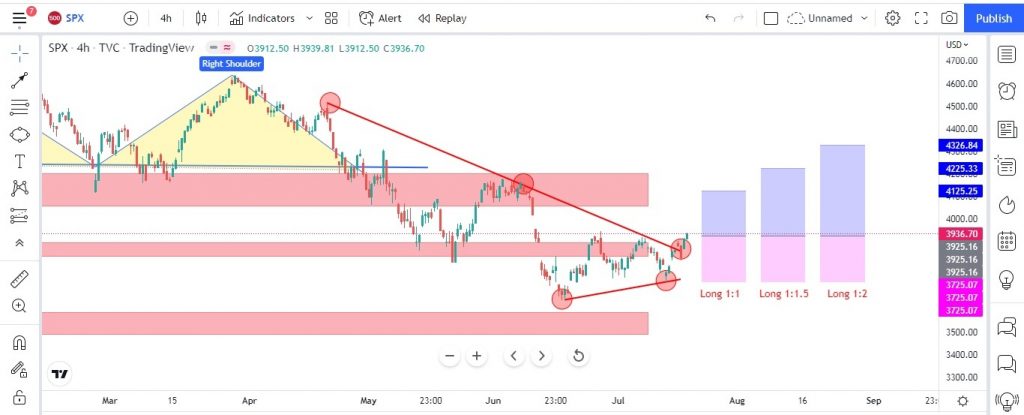
- BUY SETUP 1: Buy triggered at $ 3,925 with stop loss at $ $3,725 with target of 1:1 or $ 4,125.
- BUY SETUP 2: Buy triggered at $ 3,925 with stop loss at $ $3,725 with target of 1:1.5 or $ 4,225.
- BUY SETUP 3: Buy triggered at $ 3,925 with stop loss at $ $3,725 with target of 1:2 or $ 4,326.
Website Disclaimer
The Articles published in Blog sections of HFT Solutions, is for educational purpose only and the author is not a SEC registered analyst. The views and opinions expressed on this website are solely those of the original author(s) and other contributor(s). These views and opinions do not necessarily represent those of HFT Solutions, the https://hftsolution.com/ staff, and /or any/all contributors to this site.
All information on the Site is provided in good faith, however we make no representation or warranty of any kind, express or implied, regarding the accuracy, adequacy, validity, reliability, availability, or completeness of any information on the site. UNDER NO CIRCUMSTANCE SHALL WE HAVE ANY LIABILITY TO YOU FOR ANY LOSS OR DAMAGE OF ANY KIND INCURRED AS A RESULT OF THE USE OF THE SITE OR RELIANCE ON ANY INFORMATION PROVIDED ON THE SITE. YOUR USE OF THE SITE AND YOUR RELIANCE ON ANY INFORMATION ON THE SITE IS SOLELY AT YOUR OWN RISK.