Head & Shoulder Pattern -Historical Reference
A head and shoulders pattern is a technical indicator with a chart pattern of three peaks, where the outer two are close in height and the middle is the highest. A head and shoulders pattern—considered one of the most reliable trend reversal patterns—is a chart formation that predicts a bullish-to-bearish trend reversal.
- After long bullish trends, the price rises to a peak & subsequently declines to form a trough.
- The price rises again to form a second high substantially above the initial peak and declines again.
- The price rises a third time, but only to the level of the first peak, before declining once more.
The first and third peaks are shoulders, and the second peak forms the head. The line connecting the first and second troughs is called the neckline.
Formation of H&S Pattern –It is usually formed at the top of the upward trend.
What Does a Head and Shoulders Pattern Indicate?
The head and shoulders chart is said to depict a bullish-to-bearish trend reversal and signals that an upward trend is nearing its end. Investors consider it to be one of the most reliable trend reversal patterns.
Example: Head & Shoulder Pattern on Crude Oil -4 Hrs time frame:
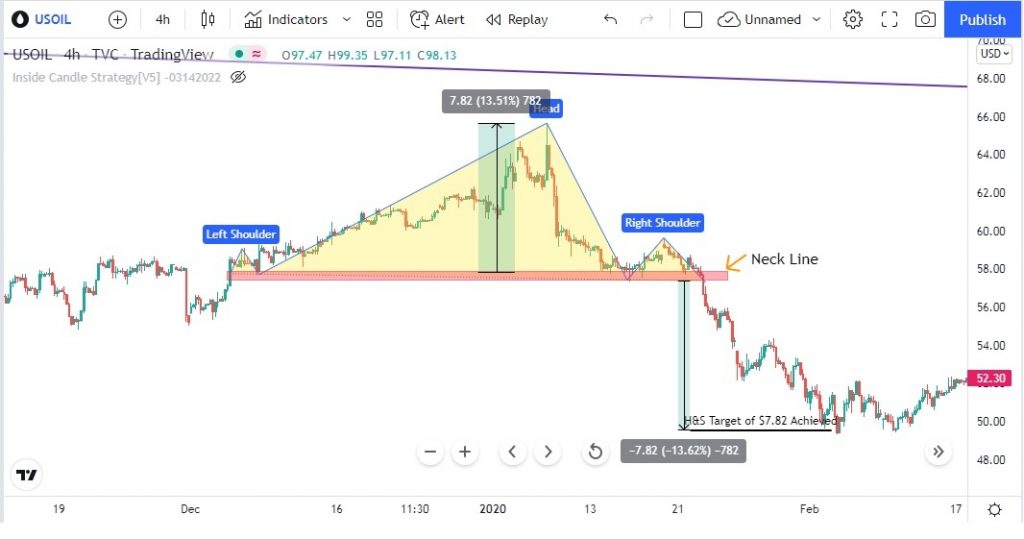
In the above example , we can clearly see the H&S formed on 4 hours time frame for crude oil on December last week 2020 when price for crude oil around $ 66. As soon as the neck line is broken it hit the target. Target is calculated by taking the distance from neck line to the high of head; here we can see the distance is $ 7.82. For profit it will be same distance from neckline minus $ 7.82 as shown in above example.
Current Scenario (Analysis done on 14th March 2022)
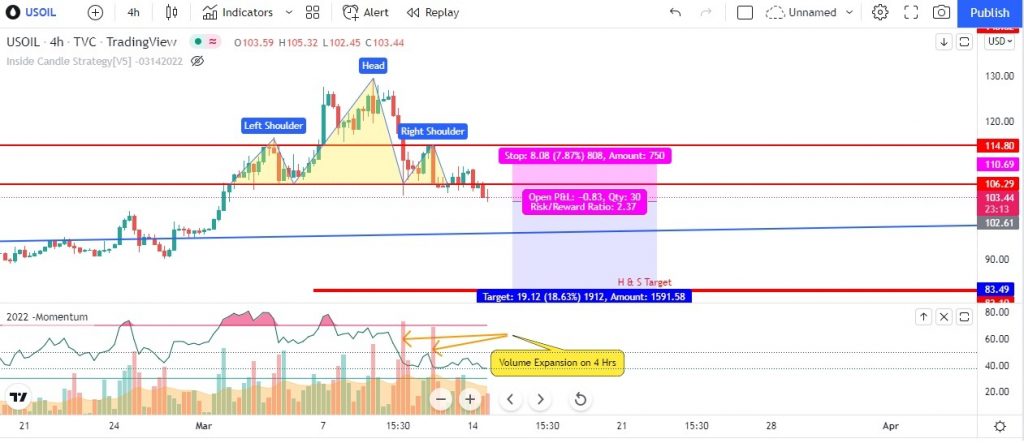
At current one can initiate a sell position as shown in above chart. Entry at $ 103.5, the stop loss will be at $ 110. One can expect a target of 1:1 ($ 96.5) or 1:2 ($ 89.5). Please note, once the order is triggered, and prices of crude oil starts trading in once’s favor, they can trail their stop loss since trading in crude oil is very risky and the prices are highly volatile. Traders can book their 50% of their profit at 1:1 risk to rewards ratio and can trail rest 50% until $ 89.5 or Head & Should target is reached. Also, one may note that the prices of crude oil depends on various factors: OPEC meeting outcome; Geo-political tension etc.
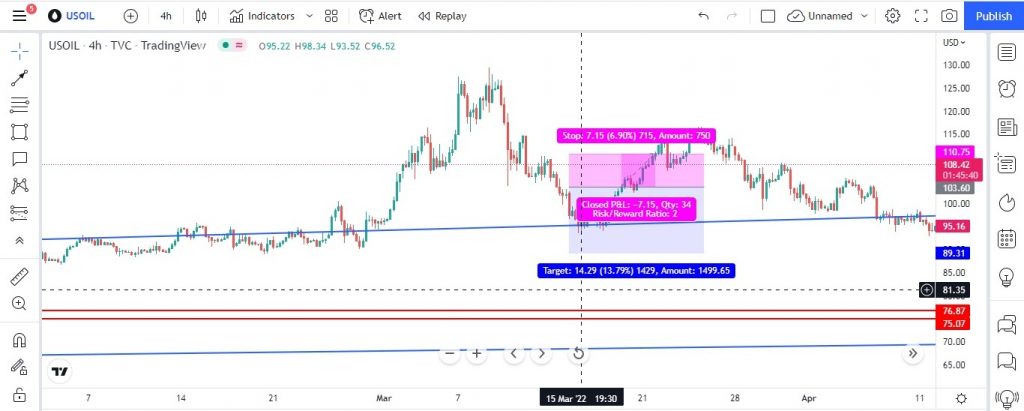
Updates on Crude Oil: For Short entry position given on 14th March 2022
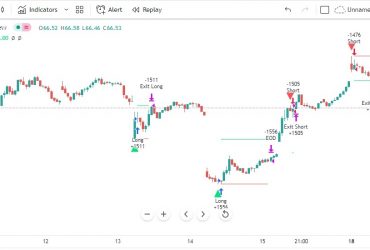
Crude oil has formed a Head & Shoulder pattern on 4 hours time frame on our last update. Also, we have given a call for short position in crude oil at level $ 103.5 with stop loss of $ 110 with a target of $ 96.5 (1:1 as RR) and $ 89.5(1:2 as RR). We can see from below chart that crude oil has hit the 1st target of $ 96.5 and made a low of $ 93.5 before hitting our trail stop loss. We also mentioned to book 50% when prices reaches a risk to reward of 1:1.
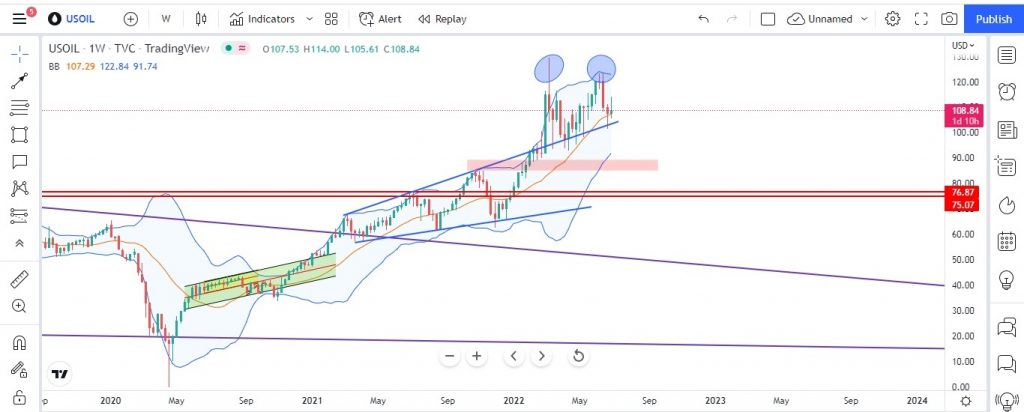
WTI Crude Oil: Analysis 30th June 2022
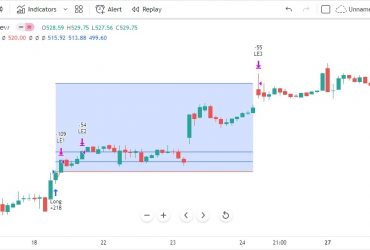
On 30th June 2022, crude oil has formed a major patter of double top. Also, from the below chart if one can observe the Bollinger band, the prices of crude oil is trading at the center line of the BB, just above the ascending broadening wedge (Blue line channel). If prices sustain below the upper trend line, one can expect the prices to retest the levels of $ 84 -$ 90 range. Also, there is a chance of taking support exactly at the center of BB and upper levels of ascending broadening wedge. For both the cases, we need further confirmation from price action. The main trend for crude oil is still bullish, it is just a retracement phase that the prices are undergoing. The final target for bullish side is $ 140; $146 and $ 176 respectively. Any pullback to the levels of $ 76 -$ 90 must be used as a good opportunity by the investor to invest in liquid black gold (Crude).
Website Disclaimer
The Articles published in Blog sections of HFT Solutions, is for educational purpose only and the author is not a SEC registered analyst. The views and opinions expressed on this website are solely those of the original author(s) and other contributor(s). These views and opinions do not necessarily represent those of HFT Solutions, the https://hftsolution.com/ staff, and /or any/all contributors to this site.
All information on the Site is provided in good faith, however we make no representation or warranty of any kind, express or implied, regarding the accuracy, adequacy, validity, reliability, availability, or completeness of any information on the site. UNDER NO CIRCUMSTANCE SHALL WE HAVE ANY LIABILITY TO YOU FOR ANY LOSS OR DAMAGE OF ANY KIND INCURRED AS A RESULT OF THE USE OF THE SITE OR RELIANCE ON ANY INFORMATION PROVIDED ON THE SITE. YOUR USE OF THE SITE AND YOUR RELIANCE ON ANY INFORMATION ON THE SITE IS SOLELY AT YOUR OWN RISK.