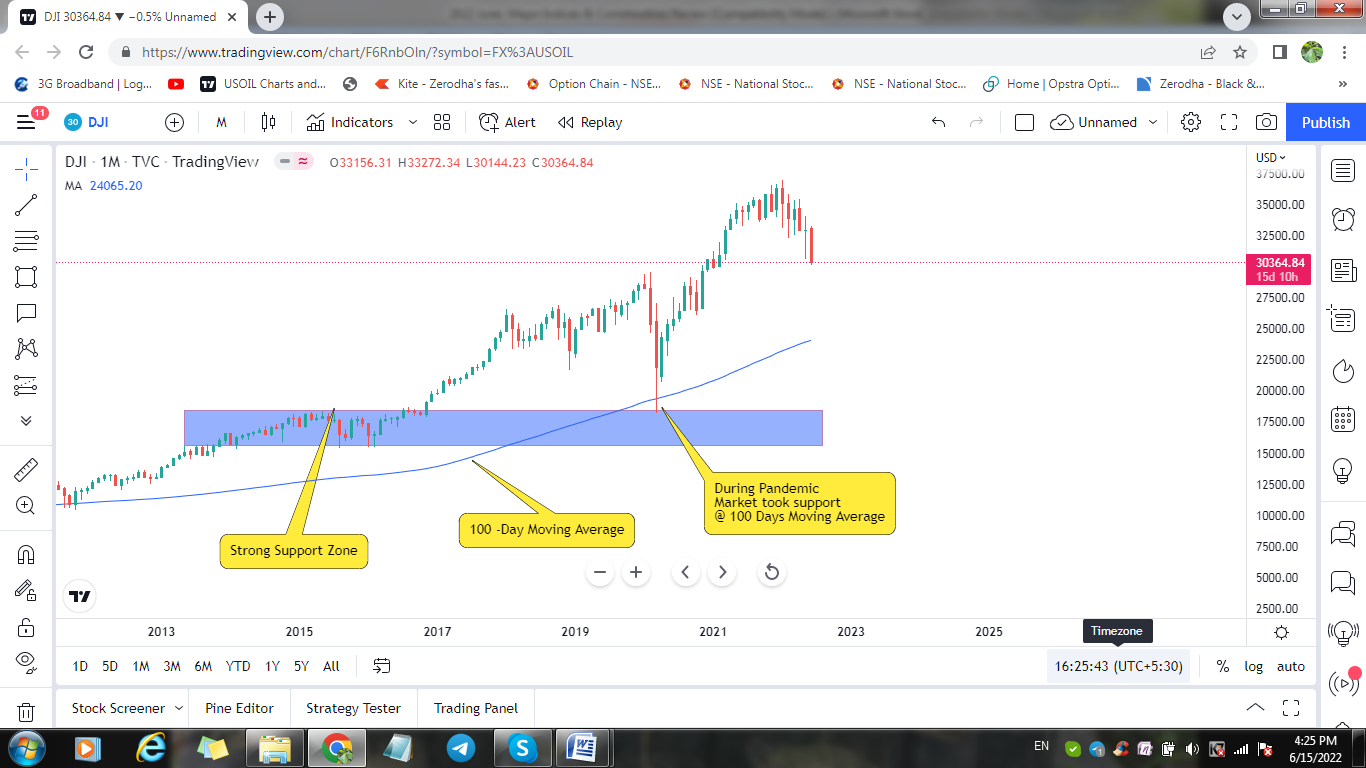
During the Pandemic in 2020, the worldwide market had a severe crash. This can also be seen in Dow Jones Industrial Average, which has fallen by nearly 38% from its all time high of 29,500. Now, most of the traders thought there may be more fall, but the Dow Jones took support at 100 Days simple moving average (Monthly Timeframe) and reversed exactly by taking support at 100 days SMA. Please, see the chart below.

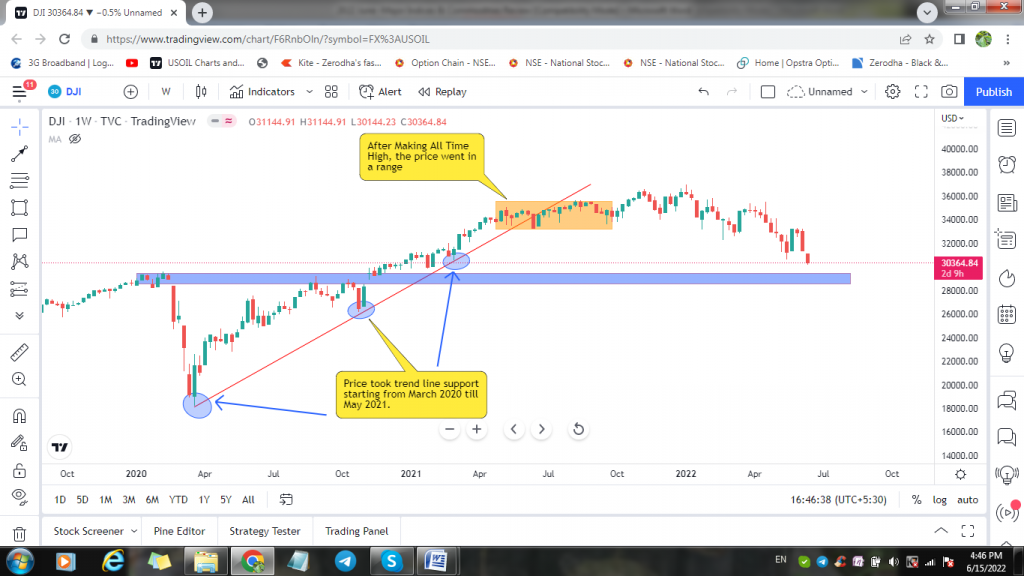
The market reversed from 100 days SMA (Monthly timeframe), and made an all time high in the month of 3rd May 2021. Prices took multiple supports at the trend line to remain bullish till it is made a new high. Now, most of the investor and small retailer have a thought it will be too bullish. But, the price went in a consolidation phase (see below the orange box where the price started to consolidate and it is when the trend line is violated for the 1st time, which was keeping the trend in bullish). Please, see the below chart.
Starting this year 2022, in spite of breaking the major trend line the Dow Jones, again made an all time high of 36,970 on dated 05th January 2022. Most of the Investor or day traders were assuming the market will continue the rally. But, if one has observed what the price action was telling us, then we would know whether to buy at current levels when market was at its high time price. The below chart explains when trend line was broken (It was the 1st sign of weakness the bull trend is witnessed since the rally started on March 2020), there was hardly any fresh buy happening at higher levels. It took 10 months for market to make a price action of Head & Shoulder (please note, the Head & Shoulder pattern occurs when market is at its peak level or all time high).
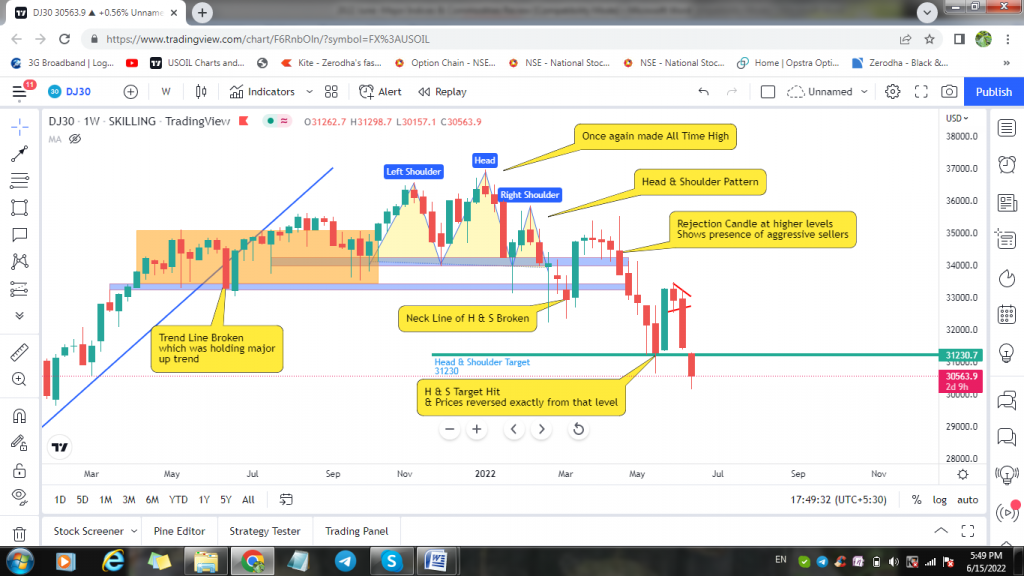
When the neckline of the Head & shoulder pattern is broken (see above chart), prices retested the higher levels and formed a rejection candle and prices started to move towards the target and one can see in the chart the price hit the target of Head & Shoulder pattern of 31,230 and the very next candle there was a reversal (or profit booking).
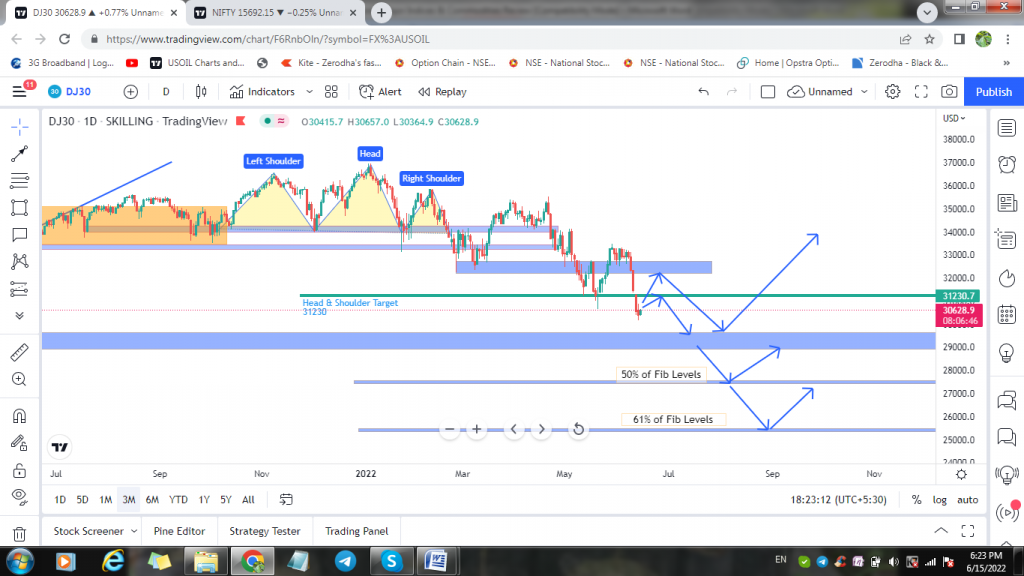
So, far we have seen when a major trend line is broken, we were able to see the sign of weakness on a weekly chart, and then the prices went in a consolidation phase and that is where it has created a head & shoulder pattern and now the market has reversed from bullish to bearish. At present if we see there is a fall of 33% of Fib levels. Now the question arises is will the market will crash further or will it reverse. At present because of fed meeting to be held on 06/15/22. The market may show a small bounce back as it has already hit the 33% of Fib levels. Strong buying can be seen at 50 to 60% of Fib levels, (we have not yet reached those levels at present). But it may not happen in one go. Market will take time, and also there has to be a time correction which is due in the market. As of now, definitely, the market is in a downtrend phase.
Current Scenario: Since there is a FED Meeting, one can expect a bounce at current levels (33% of Fibo levels). The possible scenarios are explained in the below chart. The strong buy may come at 50 to 61.8% of Fibo levels, also it is the strong support zone and buyers will be more interested at that levels, provided one has to get the confirmation at that level. Note there is a pending of time correction in the market. Market may not go up in a straight line nor does it go down in a straight line. For every impulse wave there will be a correction, one correction will be price correction and another will be time correction, only after that market will set a new direction.
Website Disclaimer
The Articles published in Blog sections of HFT Solutions, is for educational purpose only and the author is not a SEC registered analyst. The views and opinions expressed on this website are solely those of the original author(s) and other contributor(s). These views and opinions do not necessarily represent those of HFT Solutions, the https://hftsolution.com/ staff, and /or any/all contributors to this site.
All information on the Site is provided in good faith, however we make no representation or warranty of any kind, express or implied, regarding the accuracy, adequacy, validity, reliability, availability, or completeness of any information on the site. UNDER NO CIRCUMSTANCE SHALL WE HAVE ANY LIABILITY TO YOU FOR ANY LOSS OR DAMAGE OF ANY KIND INCURRED AS A RESULT OF THE USE OF THE SITE OR RELIANCE ON ANY INFORMATION PROVIDED ON THE SITE. YOUR USE OF THE SITE AND YOUR RELIANCE ON ANY INFORMATION ON THE SITE IS SOLELY AT YOUR OWN RISK.