NASDAQ: APPLE INC., (AAPL): 06/21/2022
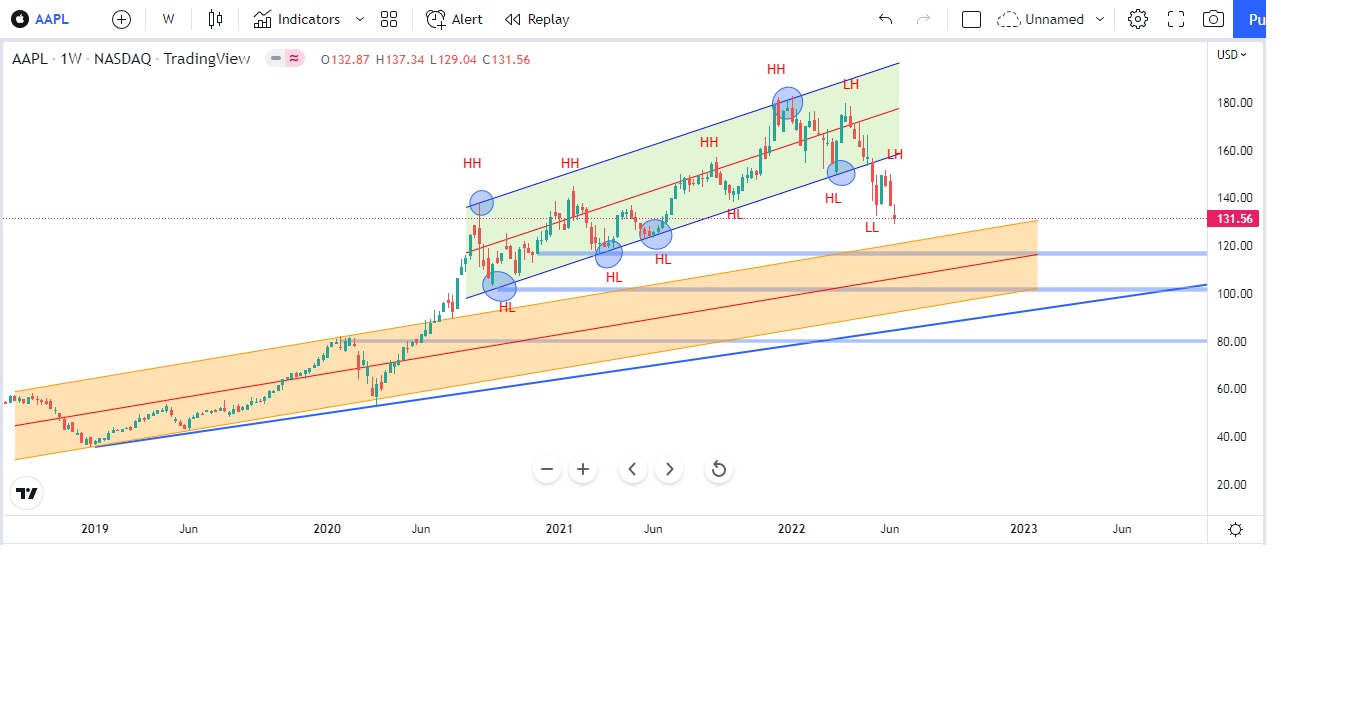
APPLE stock during the pandemic has made a low of $ 36 in the year 2019. Since, then the stock price of Apple has made an all time high of $ 182 in the month of December 2021. The stock price of Apple was in a parallel channel starting August 2020 to till May 2022. As you can see from the below chart, the Apple prices has been violated a major channel (Blue Parallel Channel) in weekly time frame. Which indicate the start of a Bearish market for the stock?
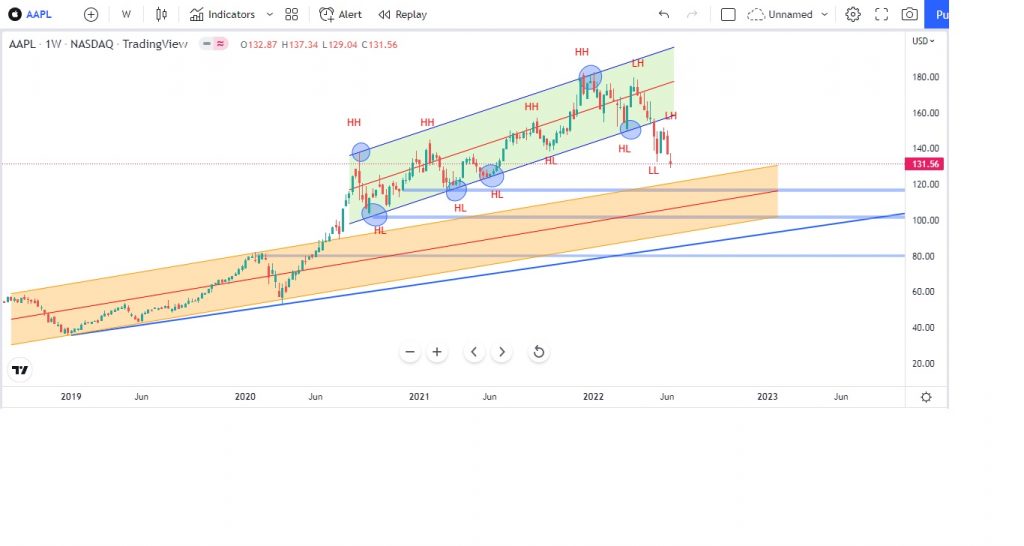
As one can clearly see the higher high (HH) has stopped forming in the APPLE chart on April 2022, and we got a confirmation when the price broke the lower parallel channel and made a lower low (LL) in weekly timeframe. Since, now we know that we are in a bearish zone, the next support area would be just below $ 120 and also that is where the orange parallel channel upper line will act as a support. If one tries to plot the Fibo on the price chart the price has already broken the 33% of Fibo and is heading towards 51% of Fibo which is $ 110. For an Investor 62% of Fibo will be the ideal place to go long provided we need confirmation at those levels. In terms of dollars it would be around $ 92 for the stock. The final target for the bear market for the APPPLE stock would be $ 68.5 which is also 78% of Fibo.
For every violation of Fibo levels, one needs to check for a proper confirmation and the above chart is on a weekly timeframe, which means prices may show a sign of reversal from bearish to bullish. The best strategy at present would be Sell on Rise (SOR) strategy. Only when prices make a double or triple bottom only then we can confirm the sentiments of the market has changed. Also, note that the above analysis is only for investor and for day traders it would be totally different analysis. Let us look at how the APPLE stock is performing on a daily basis.
On a daily chart the APPLE prices, one can clearly see that from 30th March 2022 the prices started rejecting from higher level and if we draw a trend line, one can see the trend line is acting as a resistance for the prices and we can also see that the prices got rejected multiple time when price tried to cross the trend line. Also, there is no major volume expansion seen on the bull side. Now, even if the prices cross the trend line, the next important pivot level would be $ 151. If $ 151 is breached, and the prices can sustain above these level one can say that the bear market has ended. For this, we also need volume confirmation, Fibo confirmation and chart pattern along with price action as well. At present, one can see a double bottom (Not typical text book pattern) is forming at the chart and confirmation for this is violation of major pivot level at $ 151 (see below chart).
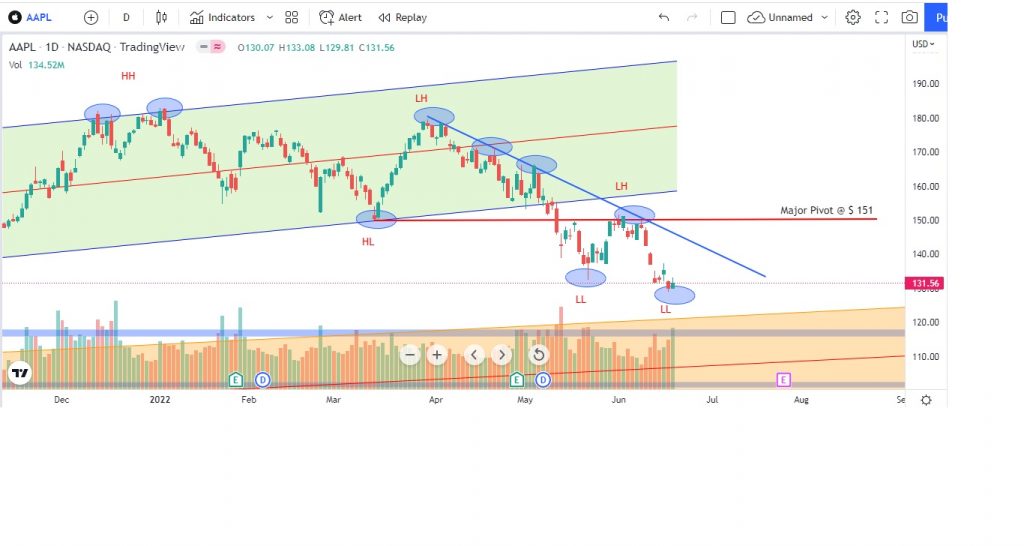
At current scenario, the APPLE prices has dropped more than 29% from its all time high, which is a strong indication of bearish market. However, when prices on the daily chart got rejected from major pivot at $ 151, the prices now had made a new lower low (LL). At this point, this is considered to be a major impulse wave and for that one can expect a bounce from current levels that is because for every impulse wave, there is a correction. The next question that arises is if there is a correction how much anticipated move one can expect? To this question, the answer will be based on Fibo levels. At present when we draw the Fibo levels starting from 2009 as low and 2022 as high, currently the prices are trading just below the 33% of Fibo. Any bounce the price may retest the 23% which is $ 148. At $ 148 50 $ 150 would be an ideal place to short in APPLE stock (of course we need confirmation when price reaches $ 148 -$150). For confirmation at this mentioned ranges, look for bearish engulfing candle or doji candle or reverse hammer candles, this is at higher timeframe. If one needs confirmation at lower timeframes, one need to see the price behavior at these levels.
NASDAQ: APPLE INC., (AAPL): UPDATES AS ON 13th JULY 2022
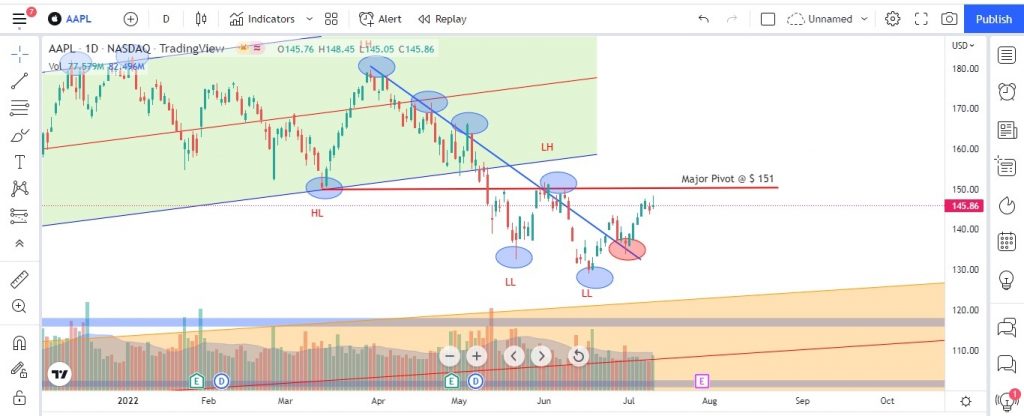
In our last analysis we have mentioned that the prices of APPLE have made an impulse move for which correction was due and prices were trading at $ 131.5 as on dated 17th June 2022 (see above chart). We also said that the correction may happen till $ 148 to $ 150 levels by using Fibo levels. At present the APPLE INC prices made a high of $ 148.45 the updated chart of Apple on a daily time frame is shown below:
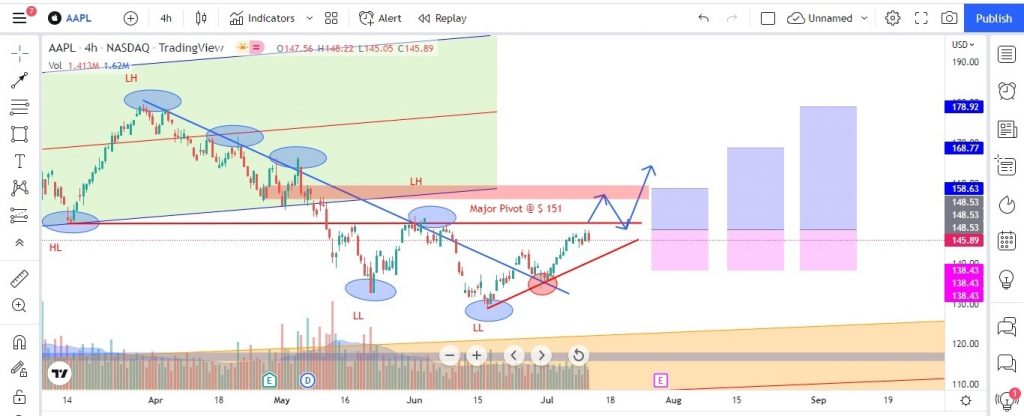
Below chart of APPLE INC is on a 4 hours time frame with buy set up. There is a major pivot at $ 151; also if we draw a trend line for the correction phase for which the price is currently taking support is shown in red color trend line. If we notice the trend line (blue color) which was holding the prices of Apple in a down trend has been violated and also a pullback at the trend line is seen (shown in red circle). Does this mean that the down trend is over? We need to get more confirmation from price action and also the price need to violate the major pivot which is at $ 151. If price sustain above $ 151 with good volume confirmation only then we can say the down trend is finished.
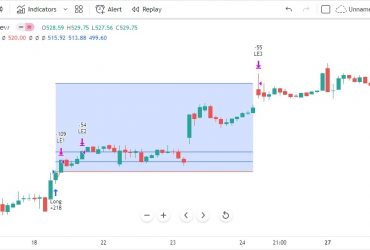
At present, the price of APPLE is trading at $ 145.89, the below chart explains the probability of APPLE INC buy set up. Below are the details of buy set up:
- BUY SETUP 1: Buy at $ 148.53, with stop loss at $ 138.43 for target of 1:1 or $ 158.63. Buy only on breakout of major pivot and on pullback to level of $ 148.53 with good volume confirmation.
- BUY SETUP 2: Buy at $ 148.53, with stop loss at $ 138.43 for target of 1:2 or $ 168.77. Buy only on breakout of major pivot and on pullback to level of $ 148.53 with good volume confirmation.
- BUY SETUP 3: Buy at $ 148.53, with stop loss at $ 138.43 for target of 1:3 or $ 178.92. Buy only on breakout of major pivot and on pullback to level of $ 148.53 with good volume confirmation.
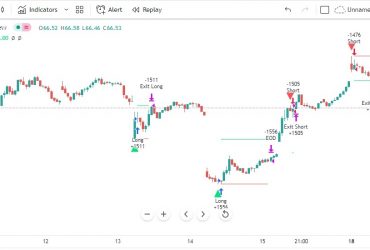
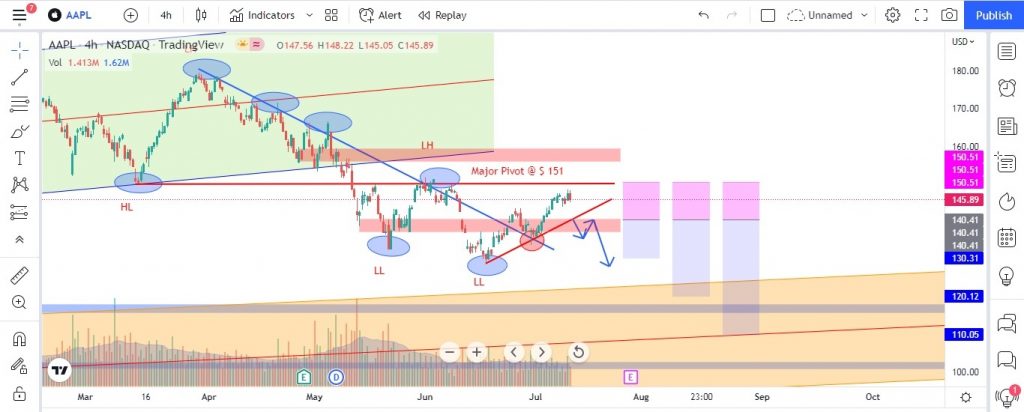
The below chart explains the probability of APPLE INC sell set up on 4 hours time frame. Below are the details of sell set up:
- SELL SETUP 1: Sell at $140.41, with stop loss at $ 150.51 and target of 1:1 or $ 130.31. Sell only when price break down the red color trend line with good volume confirmation and only on pullback when price retest the level of $ 140.41.
- SELL SETUP 2: Sell at $140.41, with stop loss at $ 150.51 and target of 1:2 or $ 120.12. Sell only when price break down the red color trend line with good volume confirmation and only on pullback.
- SELL SETUP 3: Sell at $140.41, with stop loss at $ 150.51 and target of 1:3 or $ 110.05. Sell only when price break down the red color trend line with good volume confirmation and only on pullback.
Website Disclaimer
The Articles published in Blog sections of HFT Solutions, is for educational purpose only and the author is not a SEC registered analyst. The views and opinions expressed on this website are solely those of the original author(s) and other contributor(s). These views and opinions do not necessarily represent those of HFT Solutions, the https://hftsolution.com/ staff, and /or any/all contributors to this site.
All information on the Site is provided in good faith, however we make no representation or warranty of any kind, express or implied, regarding the accuracy, adequacy, validity, reliability, availability, or completeness of any information on the site. UNDER NO CIRCUMSTANCE SHALL WE HAVE ANY LIABILITY TO YOU FOR ANY LOSS OR DAMAGE OF ANY KIND INCURRED AS A RESULT OF THE USE OF THE SITE OR RELIANCE ON ANY INFORMATION PROVIDED ON THE SITE. YOUR USE OF THE SITE AND YOUR RELIANCE ON ANY INFORMATION ON THE SITE IS SOLELY AT YOUR OWN RISK.