NASDAQ: MICROSOFT CORPORATION (MSFT): 06/21/2022
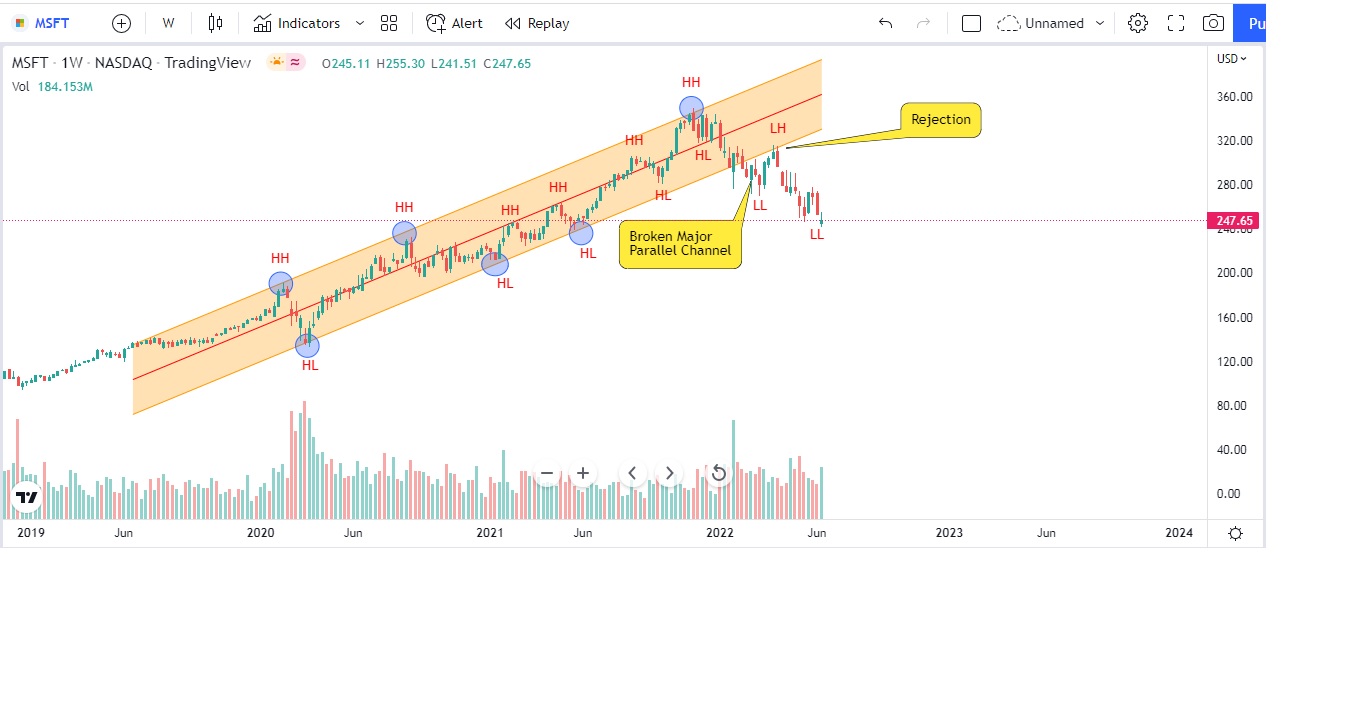
Microsoft stock prices during the pandemic did not fell as much as APPLE stock fell in 2009. However, the stock price is trading in a major parallel channel since beginning of 2020. Microsoft made an all time high of $ 349.67 in the month of November 2021. Since then the prices for a couple of weeks went into a range. Starting this year in the month of February 2022, the lower line of parallel channel was broken which indicated the stock was heading in a bearish territory, and for this we got the confirmation from price action when we saw the prices is being rejected from the lower parallel channel. Please see the below chart with explanations in details.

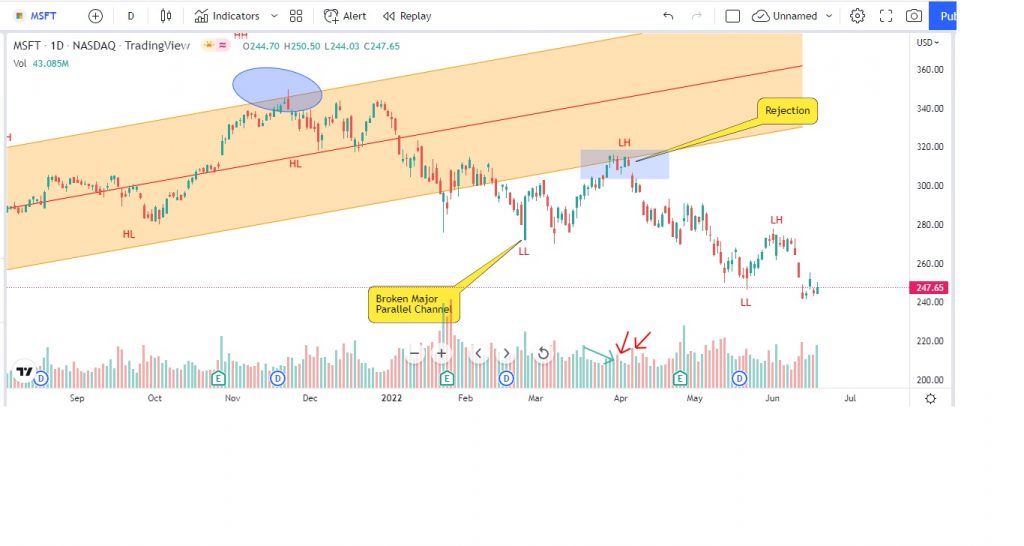
On a daily time frame if we analyze, the Microsoft stock when broken the bottom parallel channel, the prices retested the channel. Let see how on a daily timeframe we can get the confirmation since we already got confirmation on weekly timeframe about the rejection. Below chart is of daily time frame and let’s start with candlestick: if we observe the candle in the blue rectangle box, the bull candles is clearly losing its strength some of them even formed the doji candle (doji candle indicates indecision in the market), which is our 1st confirmation. Second, we can also observe that bearish candle body is greater than bull candle. If we still go on a lower time frame actually the price has made a rectangle range before breaking the lower side of the rectangle. This is our second confirmation. The final confirmation will be in terms of volume expansion. From the below chart one can clearly see that volume of bull candles are being reduced (see below volume chart) and is highlighted with green arrow. Also, if we observe when the price was in a rectangle range the volume expansion is clearly visible on the bear candles. Once we get the confirmation we can enter the trade after breakout of the range happens, by keeping a small stop loss above the range and for the take profit one can go for 1:2 since we are trading with the trend. Here we can clearly see that we are able to get more than our 1:2 risk to reward ratio.
Now, let us analyze the Microsoft stock from a different angle and will try to find out whether we were able to find out when the price started to enter in bearish zone, by using different chart patterns.
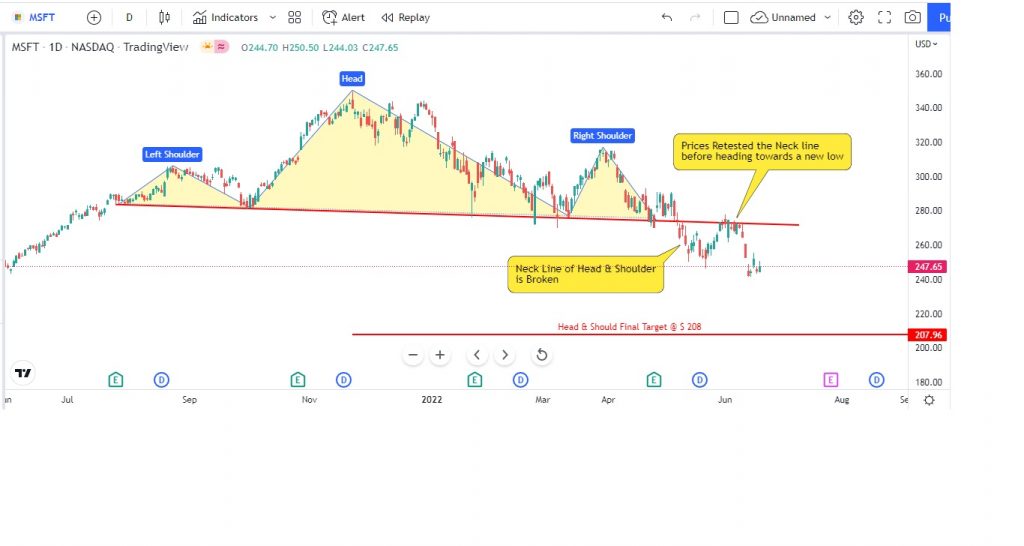
Here for example, we will take Head & Shoulder pattern which has occurred at the top when Microsoft stock price was trading near all time high. From the below chart we can clearly see that there was a Head & Shoulder Pattern occurred at the top, when Microsoft stock was in Bullish trend. The neck line of the Head & Shoulder pattern was violated in the month of May 2022, by trading below the neck line, it indicated that bull trend was of near completing. To confirm that we need to wait till the prices retest the neckline and one has to see how price behaves near the neckline. One can clearly see from the chart that prices were again in a range (the below chart time frame is on daily). For nearly 7 -8 days the prices were in the range, neither it was breaking upside or downside, when the downside range was broken that is where we get our 2nd confirmation that we have entered in bear market. Now, one can initiate a short position in Microsoft with Stop loss just above the right shoulder and take profit of 1:2. Please, not the target for head and shoulder pattern is coming out at $ 208. This may not happen in one go. Since, the fluctuation of prices depends on so many other factors too.
Microsoft stock at present is in bearish trend. However, if we analyze on a daily timeframe there is one more channel which is being formed. For Head & Shoulder is currently active, if the price make a move in upward direction, then the Head & Shoulder pattern will be failed and we can see prices will be heading towards the upper channel where our major pivot @ $ 284. If prices sustain above $ 284 and breaks the upper trend line we can say the H & S pattern has failed and we once again enter the in the bullish zone. For which we need confirmation when price of Microsoft reaches $ 284.
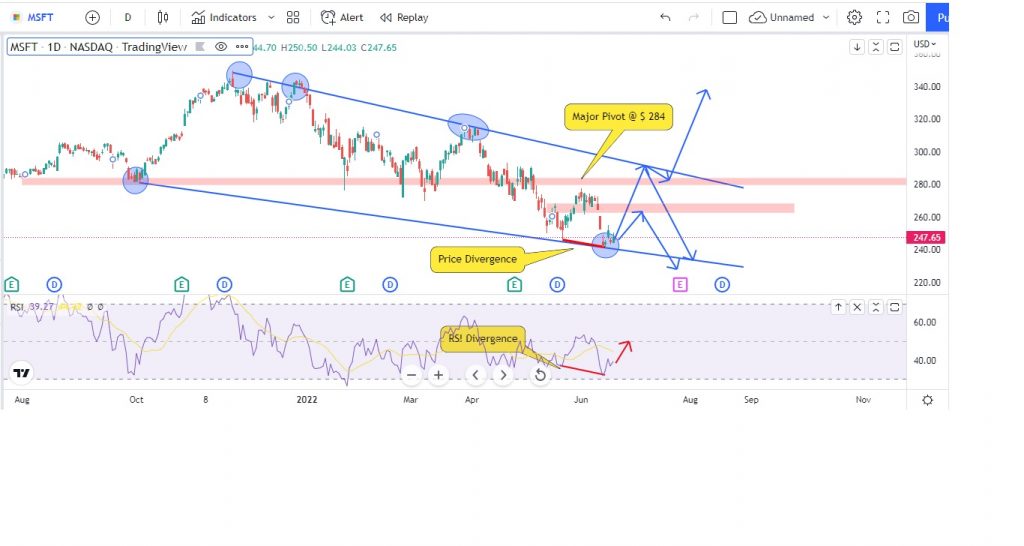
At current scenario, if we see the price action, the price is looking for a correction or bounce from these level of $ 247. We can confirm this by RSI. The RSI has hit hard as compared to prices which means bears at this level were unable to take the prices lower so a bounce is expected. Also, there is a divergence of Price to RSI and a price is slightly oversold but good enough on RSI above level of 30. The possible move the price can make for Microsoft stock is shown using the blue line.
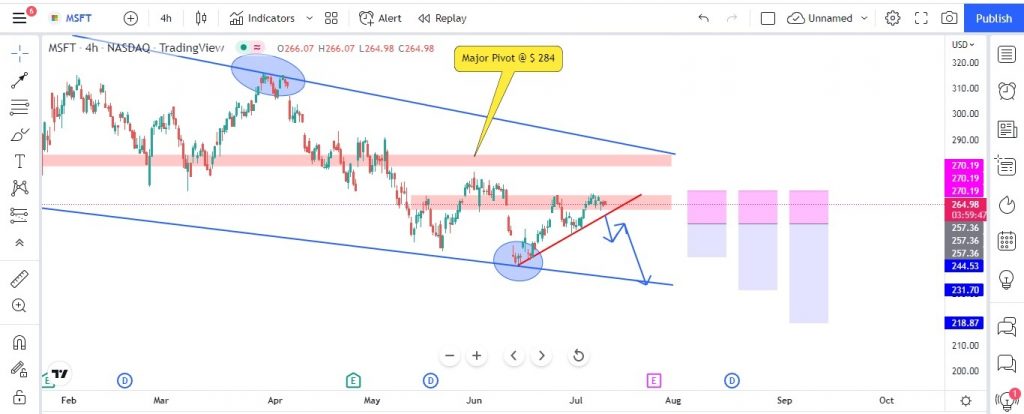
NASDAQ: MICROSOFT CORPORATION (MSFT): UPDATES AS ON 12th JULY 2022
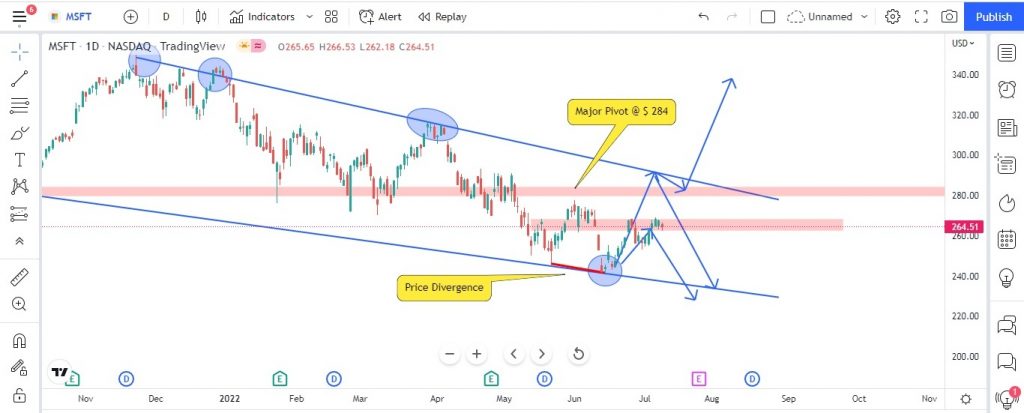
As per our previous analysis on Microsoft on dated 21st June 2022, we have mentioned that a bounce is expected from level 247 and at present the prices of Microsoft is trading at 264 as on dated 12th July 2022 (Made high of $ 269.5). Below is the updated chart of Microsoft on daily time frame. Currently the prices are trading at the important resistance level which is shown in red color rectangle box.
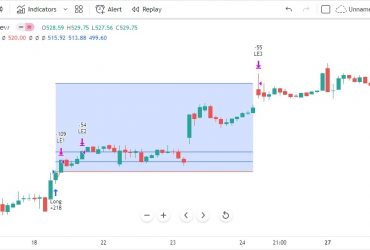
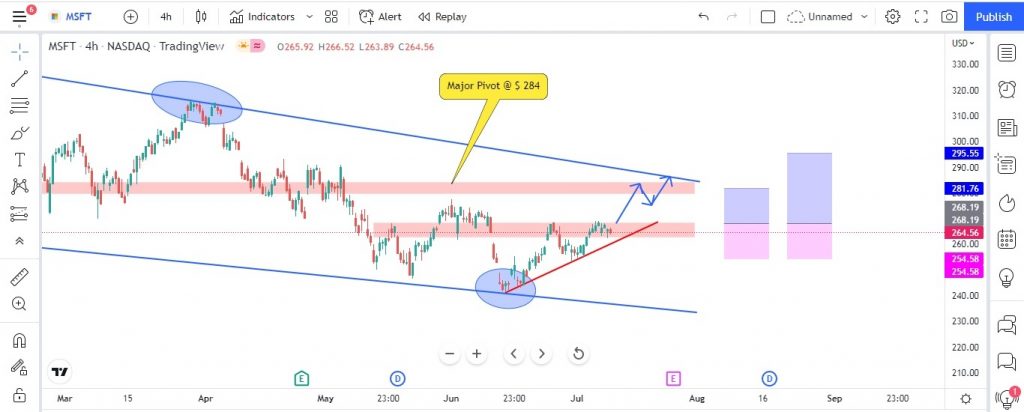
Below chart of Microsoft is plotted on a 4 hours time frame with buy set up. The details are as follows:
- BUY SETUP 1: Buy above $ 268.20 with stop loss at $ 254.58 with target of 1:1 or $ 281.75.
- BUY SETUP 2: Buy above $ 268.20 with stop loss at $ 254.58 with target of 1:2 or $ 295.55.
Please note, since the main trend is bearish and we are taking trade of buy in opposite direction which makes this buy set up more risky.
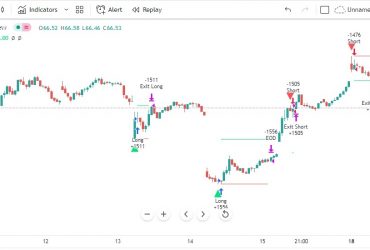
The below chart of Microsoft plotted on 4 hours time frame is for short set up with proper risk to reward ratio and the details are as follows:
- SELL SETUP 1: Sell when prices breakdown the red trend line & only after pullback at level $ 257.35 with increase volume confirmation of breakdown, stop loss is at $ 270.20 with initial target of 1:1 or $ 244.55.
- SELL SETUP 2: Sell when prices breakdown the red trend line & only after pullback at level $ 257.35 with increase volume confirmation of breakdown, stop loss is at $ 270.20 with second target of 1:2 or $ 231.70.
- SELL SETUP 3: Sell when prices breakdown the red trend line & only after pullback at level $ 257.35 with increase volume confirmation of breakdown, stop loss is at $ 270.20 with third target of 1:3 or $ 218.90.
Please, note on a higher time frame we already have a head and shoulder pattern which is active and will be invalid when prices of Microsoft starts trading above the major pivot of $ 284 with further confirmation, until then any news related to stock specific or global negative news will trigger more bearishness in the stock. Also, when entered in position and price action moves is as per view one can start to trail their stop losses accordingly.
Website Disclaimer
The Articles published in Blog sections of HFT Solutions, is for educational purpose only and the author is not a SEC registered analyst. The views and opinions expressed on this website are solely those of the original author(s) and other contributor(s). These views and opinions do not necessarily represent those of HFT Solutions, the https://hftsolution.com/ staff, and /or any/all contributors to this site.
All information on the Site is provided in good faith, however we make no representation or warranty of any kind, express or implied, regarding the accuracy, adequacy, validity, reliability, availability, or completeness of any information on the site. UNDER NO CIRCUMSTANCE SHALL WE HAVE ANY LIABILITY TO YOU FOR ANY LOSS OR DAMAGE OF ANY KIND INCURRED AS A RESULT OF THE USE OF THE SITE OR RELIANCE ON ANY INFORMATION PROVIDED ON THE SITE. YOUR USE OF THE SITE AND YOUR RELIANCE ON ANY INFORMATION ON THE SITE IS SOLELY AT YOUR OWN RISK.