E-Mini Nasdaq-100 futures (NQ) from CME Group is a contract that enables futures traders to participate in the Nasdaq-100 market index. More specifically, the NQ offers trader’s exposure to the 100 leading non –financial US large –cap companies traded on the NASDAQ stock exchange.
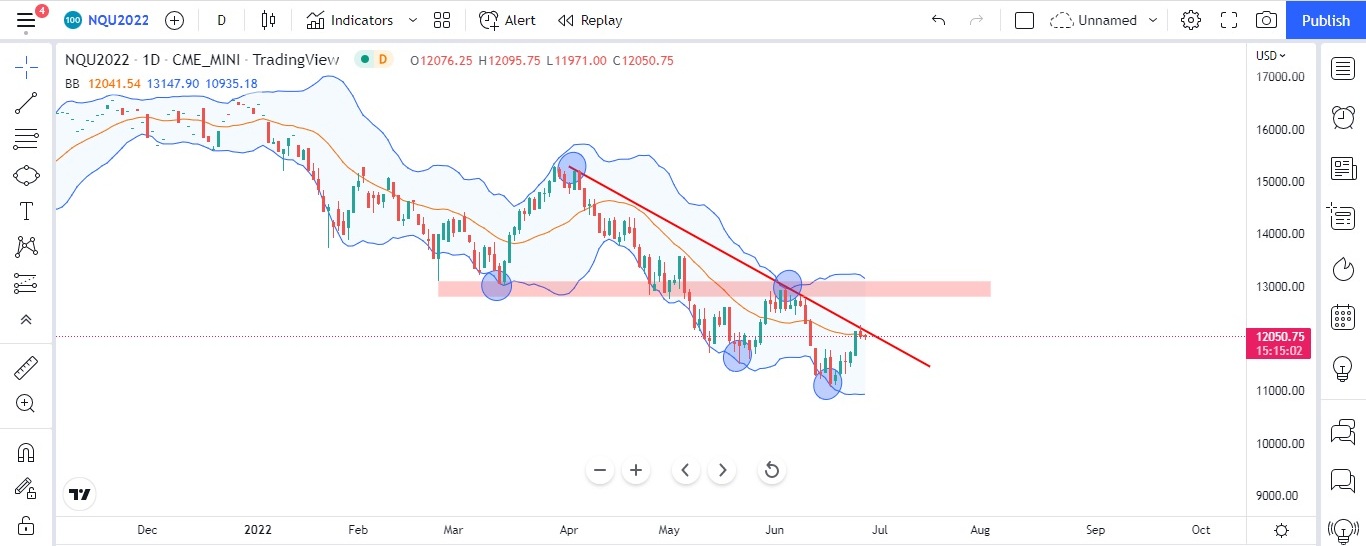
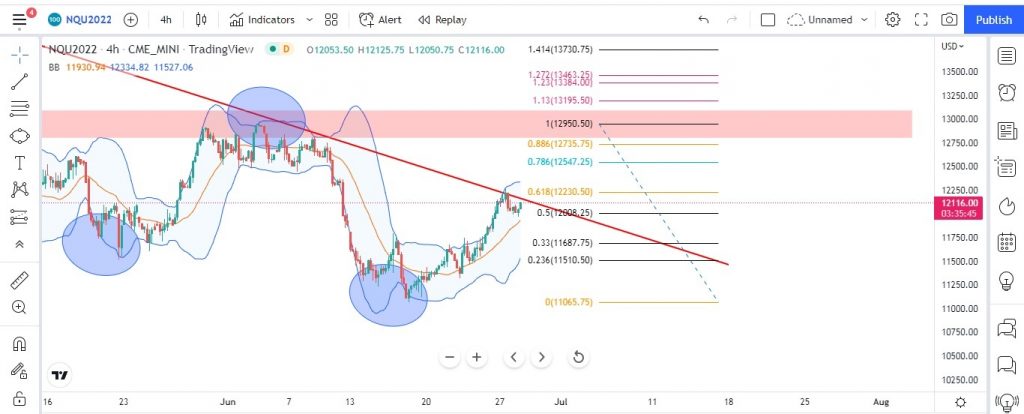
Below figure is plotted on a daily time frame for E-Mini Nasdaq-100 futures (NQ) and the contract is for September -2022. One can clearly see from the chart that NQ took support exactly at 11100 levels where the Bollinger Bands lower levels by forming an inside candle on a daily time frame and from there we can see a bounce in NQ. Currently the NQ is trading at the major trend line where it has taken multiple rejections. If NQ breaks the trend line the next major pivot it would face will be at 13000 and also 13000 will be key psychological levels to watch out for.
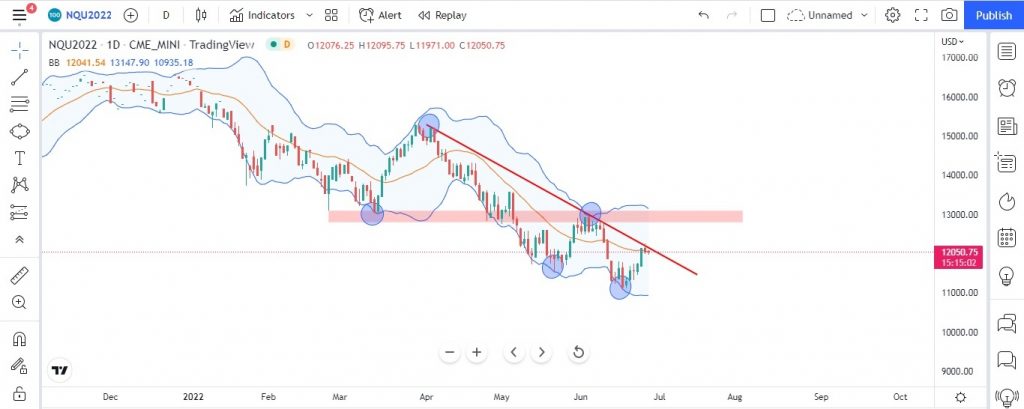
The chances are high for NQ to test 13000 levels. Any violation and price sustaining above the 13000 levels one can expect for short term bullishness in the NQ. Also, it must be well noted here that the main trend is still downtrend (Bearish) until we get confirmation from price action as well as from global clues like: Inflation data; Fed Rate cuts; Geo –political tensions etc. If prices get a strong rejection from these levels then the NQ may make another low, again for this to happen we need proper confirmation from price action, candlestick patterns etc. as of now we don’t see any chart pattern and also if we observe NQ has formed a double bottom (Not typically text book pattern), the confirmation we can get only when prices breach the 13000 important psychological levels and needs to sustain above those levels. The prices have to sustain above 78% of Fibo levels to remain in bullish trend for short term currently it is trading at 61% of Fibo levels. See below chart on 4 hours with Fibo levels.
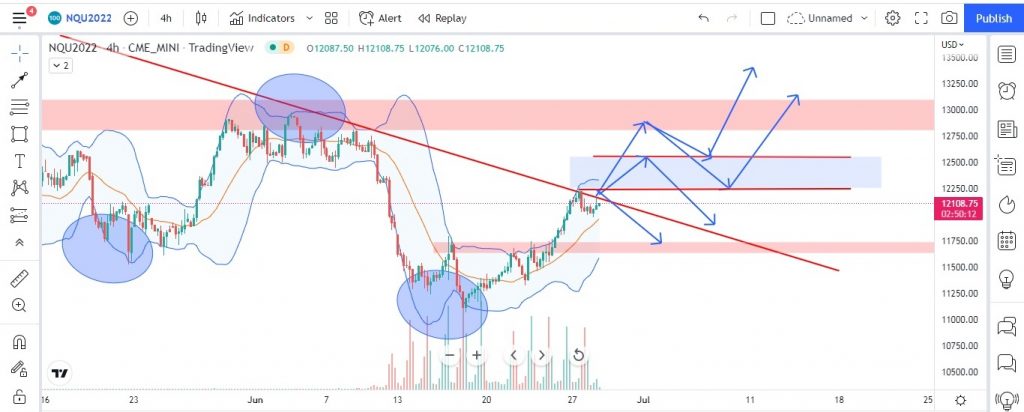
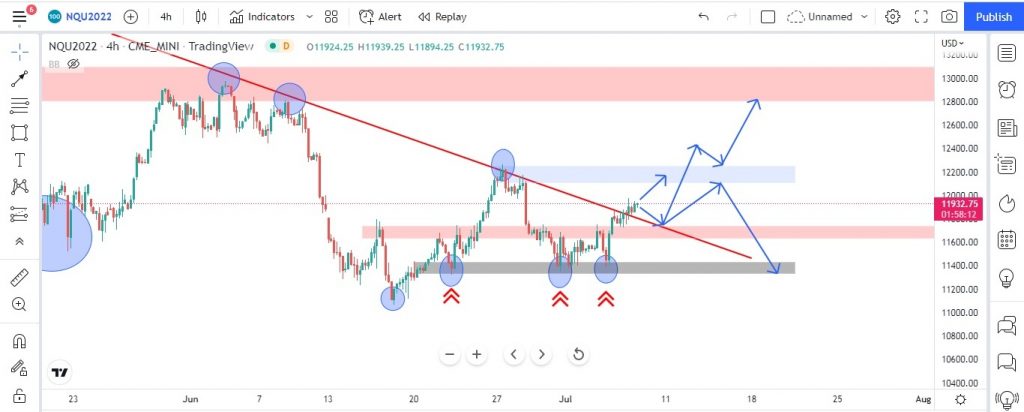
For NQ, the possible price action is shown in below figure with blue arrow marks. Since the blue zone is a crucial deciding factor for the prices. Just above the blue zone it will be trapping zone for bulls (price may give a false breakout on upper side, before making a new low, so one has to be cautious and must trade with proper money management and must trade with only 25% of their total lots size). Since global cues are not so positive any negative news will definitely attract bears from these crucial levels.
E-MINI NASDAQ FUTURES (NQ) –SEP 2022: UPDATES AS ON: 07/07/22
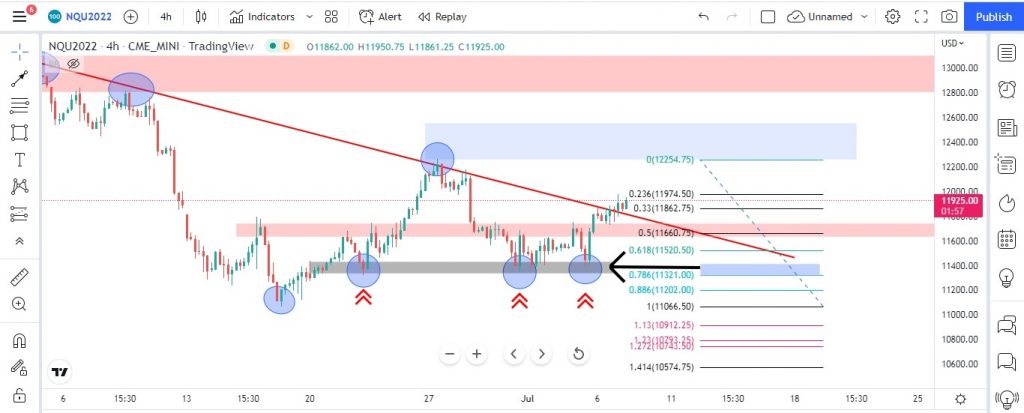
In our last analysis on dated 28th June, it has been mentioned that prices of NQ were trading at 61.8% of Fibo levels and below chart of NQ is plotted on a 4 hours time frame. One can notice that prices of NQ got rejection exactly from 61% of Fibo levels and also if we notice that there was a red trend line where prices got rejection and headed towards the support level of 11,650. In fact, the prices even the broke the 11,650 levels and took support at 11,400 levels twice, which was also, the lower line of Bollinger Band which is highlighted in blue circles.
If we plot Fibo ratio, one can clearly see the prices of NQ after getting rejection from trend line and 61% of Fibo levels, it headed downwards, where the support is seen at 71% of Fibo levels (Shown in black arrow). These levels of 71% of Fibo have been tested twice along with BB before the prices get reversed.
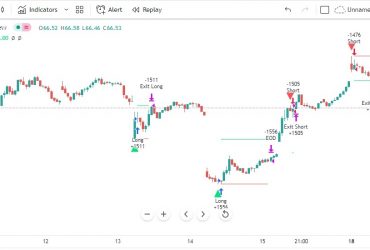
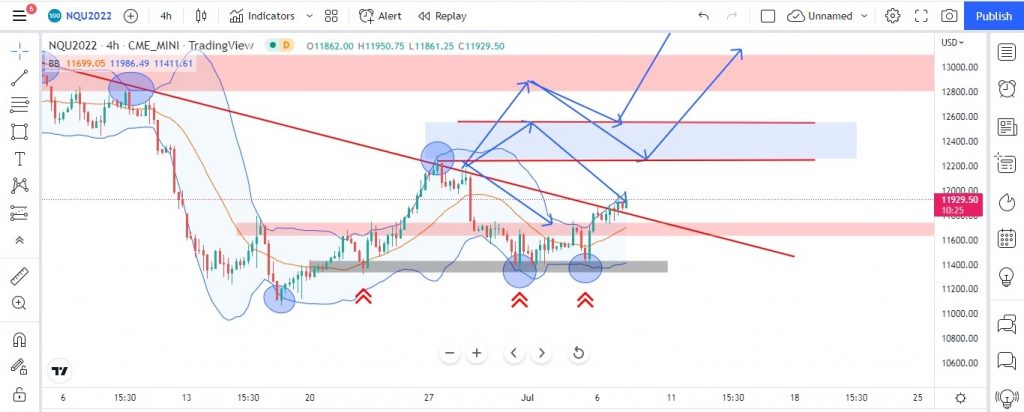
After testing support @ 11,380 twice, now the price of NQ has broken the trend line. The below chart explains in details with possible price movement indicated with blue arrows:
From the chart of NQ which is plotted in 4 hours time frame we can see the price has stopped making lower low which means Bulls are trying to take control of the prices of NQ. If prices of NQ sustain above 12,200 levels we can see the possible target of 12,800 to 13,000. Also, 13,000 will act as a strong resistance and is also a psychological level to watch out for.
One can initiate a buy at current level of 11,944 with stop loss just near the last swing low of 11,470 and possible target of 1:1 or (12,417 level for 1st target) and 1:2 or (12,846 level for 2nd target) and final target of 13,150 level. See below the RRR (Risk to Reward Ratio) with pictures.
Please note, once order gets placed and trade is in your favor, trail your stop loss and book your profit at target 1 (Book 50% of total qty.) & rest can be trailed for target 2 (book 25%) and final target of 13,150.
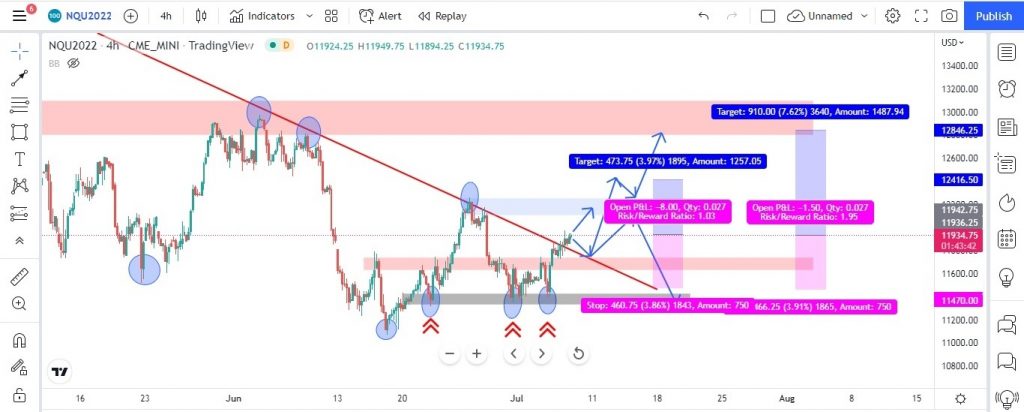
Please note, the above buy set up is only for risky trader since the main trend is downwards and we are trading against the main trend. The reason for giving buy set up at current levels is because the risk to rewards is best suiting at current positions.
E-MINI NASDAQ FUTURES (NQ) –SEP 2022: UPDATES AS ON 20th JULY 2022
As discussed in our last analysis for NQ Sept contract that there was a buy opportunity at $ 11,944 with stop loss just below the last swing low of $ 11,470 with target of 1:1 or 1:2. Below chart is of NQ for Sept contract updated as on 20th July 2022 on a 4 hour time frame.
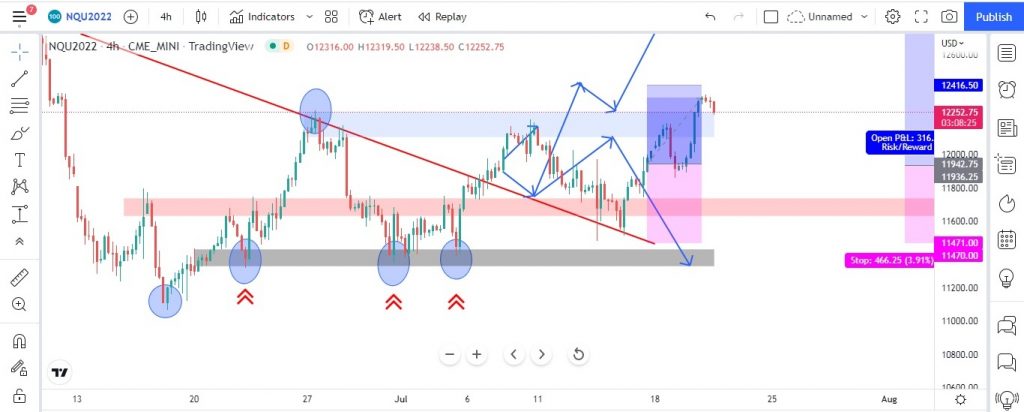
On 13th July the NQ made a low of $ 11,479 and exactly bounced from that level and made a high as on 20th July is $ 12,358 and the target of 1:1 is at $ 12,417. One can start trailing their stop loss till the target of 1:2 is achieved or trailing stop loss is hit.
E-MINI NASDAQ FUTURES (NQ) –SEP 2022: UPDATES AS ON 8th August 2022:
As per our previous analysis on dated 28th June, we have given a buy set up for NQ for September 2022 future contract and we have clearly mentioned the entry, exit and with targets. Below are the details of buy set up that was given on 28th June 2022 for NQ September 2022 future contract:
One can initiate a buy at current level of $ 11,944 with a stop loss just near the last swing low of $ 11,470 and possible target of 1:1 or ($ 12,417 level for 1st target) and 1:2 or ($ 12,846 level for 2nd target) and final target of $ 13,150 levels.
Below char of NQ is plotted on 4 hours time frame and analysis is being updated on 8th August 2022 with the buy setup that has been shared on 28th June 2022.
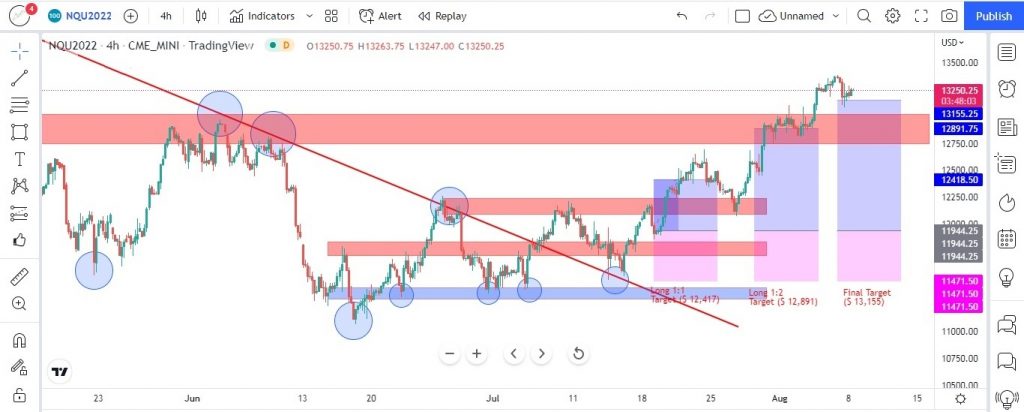
As you can see from the updated chart all our targets has been achieved final target was placed at $ 13,150 even that has been achieved with current market price as on 8th August 2022 is $ 13,250.
Current Scenario as on 08/08/2022
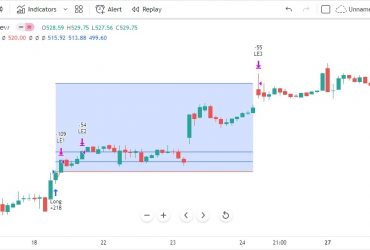
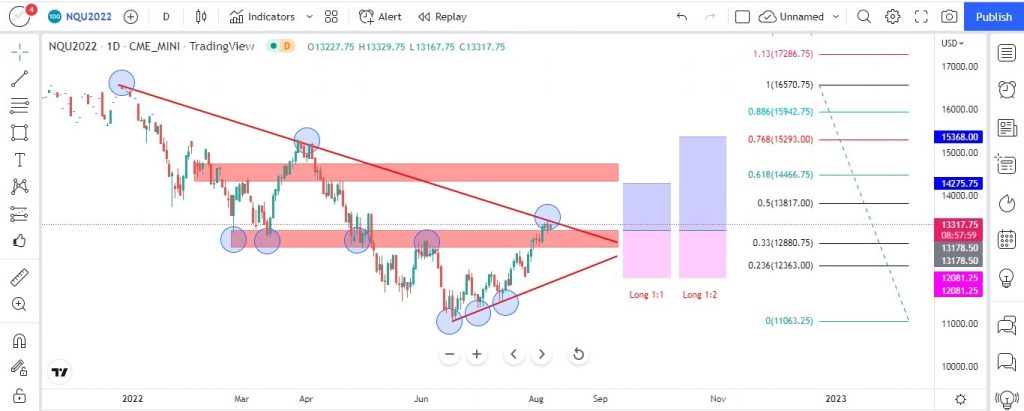
At present we have plotted NQ on daily time frame showing key levels along with Fibo levels (Draws from all time high to low of June). Also we have plotted new buy set with risk to reward ratios of 1:1 & 1:2 respectively. The details of buy setup are as follows:
- Buy Set up 1: Entry at $ 13,178, with stop loss at $ 12,081 with target of 1:1 (or $ 14,275). Provided one can initiate a buy on breakout of above trend line and only on pullback at 13,178 levels along with proper confirmation.
- Buy Set up 2: Entry at $ 13,178, with stop loss at $ 12,081 with target of 1:2 (or $ 15,368). Provided one can initiate a buy on breakout of above trend line and only on pullback at 13,178 levels along with proper confirmation.
Website Disclaimer
The Articles published in Blog sections of HFT Solutions, is for educational purpose only and the author is not a SEC registered analyst. The views and opinions expressed on this website are solely those of the original author(s) and other contributor(s). These views and opinions do not necessarily represent those of HFT Solutions, the https://hftsolution.com/ staff, and /or any/all contributors to this site.
All information on the Site is provided in good faith, however we make no representation or warranty of any kind, express or implied, regarding the accuracy, adequacy, validity, reliability, availability, or completeness of any information on the site. UNDER NO CIRCUMSTANCE SHALL WE HAVE ANY LIABILITY TO YOU FOR ANY LOSS OR DAMAGE OF ANY KIND INCURRED AS A RESULT OF THE USE OF THE SITE OR RELIANCE ON ANY INFORMATION PROVIDED ON THE SITE. YOUR USE OF THE SITE AND YOUR RELIANCE ON ANY INFORMATION ON THE SITE IS SOLELY AT YOUR OWN RISK.