An electronically traded futures contract one fifth the size of standard S&P futures, E-mini S&P 500 futures and options are based on the underlying Standard & Poor’s 500 stock index. Made up of 500 individual stocks representing the market capitalizations of large companies, the S&P 500 Index is a leading indicator of large-cap U.S. equities.
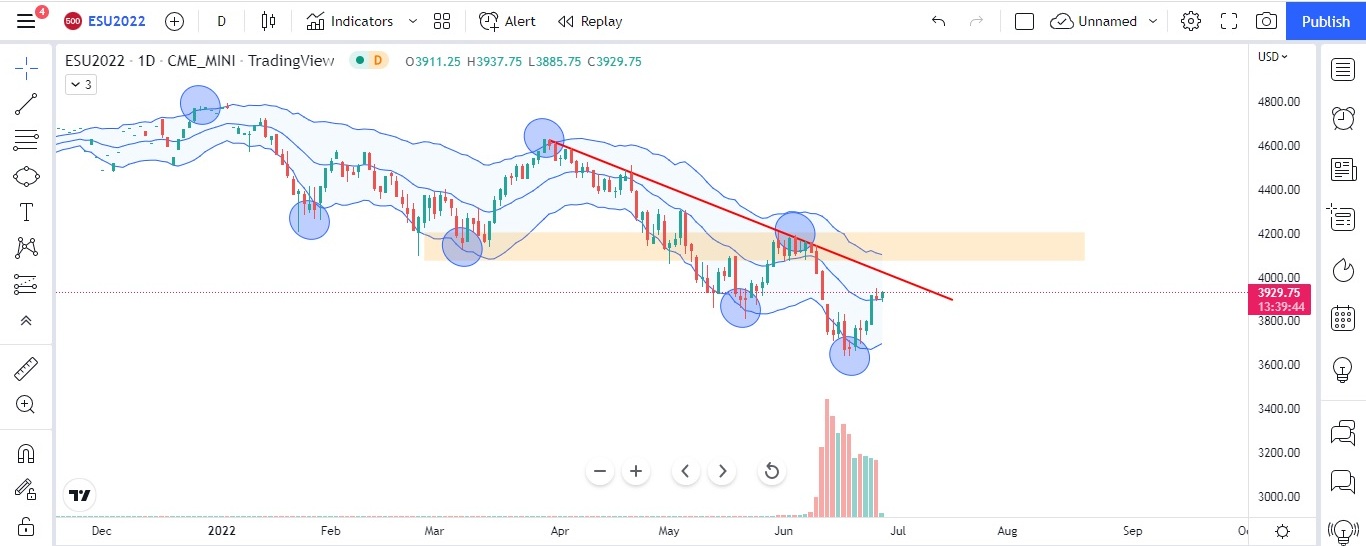
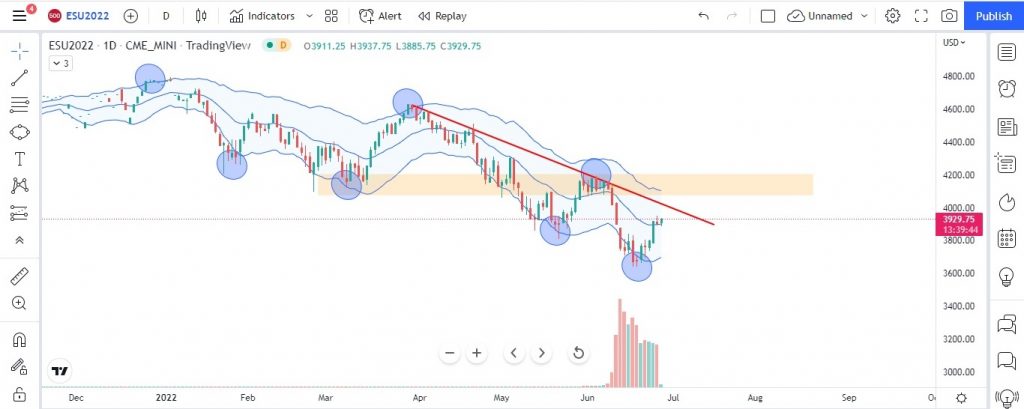
Below figure illustrates ES on a daily time frame for the month of September 2022 contract. Since the ES is already in the downtrend by making simple lower low (LL) from the price action perspective. If we plot the Keltner channel we can see when prices made a lower low on June 16th 2022, the prices were below the lower channel of Keltner. It is exactly where the next candle has made a doji (Doji candle indicates indecision in the market), and prices exactly reversed from those levels of 3670. Presently, the price is trading at the Keltner channel middle band and also we can see there is a major trend line which is holding the down trend. If bulls are strong then the prices has to face multiple resistances and also 4200 will be the key pivot level to watch out for.
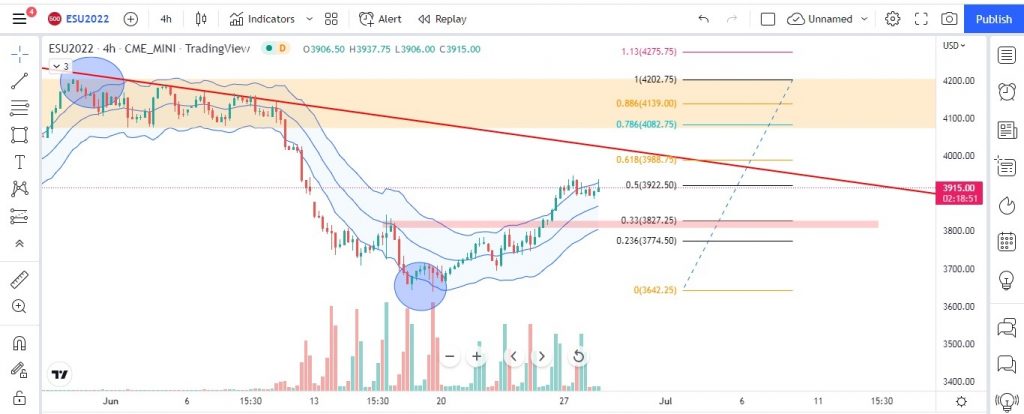
Currently, the price is testing the 51% of Fibo levels. Even volume on 4 hours indicates that there are quite some positive buyers present at these level (Volume expansion is seen). But one has to watch out how the level of 51% of Fibo will be reacted by buyers. Also, it must be noted that if we get a rejection from 51%, the prices may retest the 33% of Fibo. If the 33% failed to hold down the prices, again we can see a new low in ES for which we need further price action combined with confirmation from candlestick patterns. Below figure shows the price action with respect to Fibo levels.
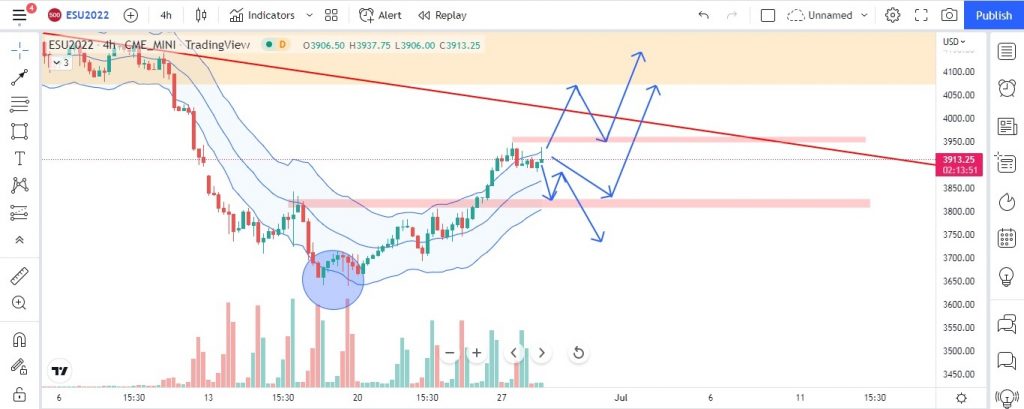
ES possible price movement is shown in below figure with blue arrows. If someone wants to take a trade one must get a confirmation at the below mentioned levels (blue arrow) since the volatility is more in the market.
E-MINI NASDAQ FUTURES (ES) –SEP 2022: UPDATES AS ON: 07/07/22
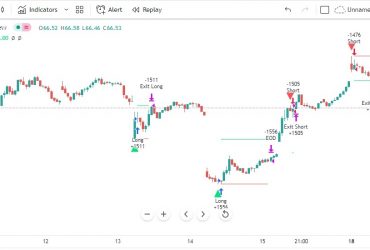
As discussed in our analysis on dated 28th June 2022, the ES price got rejection exactly from 51% of Fibo levels which is 3,950 (see rectangle red box) by making double top and retested the level of 33% & also 23% of Fibo levels before given us a reversal. The below chart shows the updated price action that has happened from 28th June to 7th July 2022 on a 4 hours time frame for ES Future for September contract.
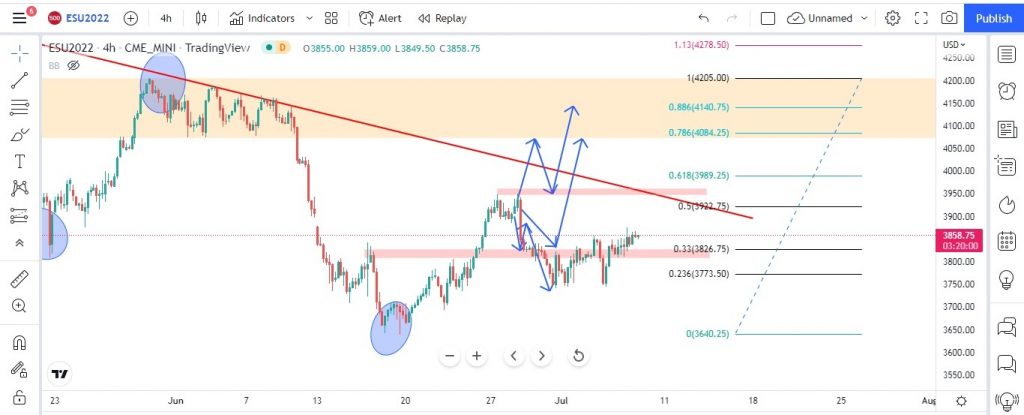
The below chart of ES on 4 hours explains the price taking support at 61% of Fibo ratio, and now the price have been reversed (see the blue arrow). Also, if we see the Bollinger Band the prices took support at the lower channel of BB twice before getting reversed. On a daily time frame, the RSI is at 47. The buying pressure is not that great since the price of ES are already in downtrend. One can see a momentum if price of ES sustain above 3,950 level and also it is the key level since trend line resistance which is holding the price in bear territory is also at 3,950 level.
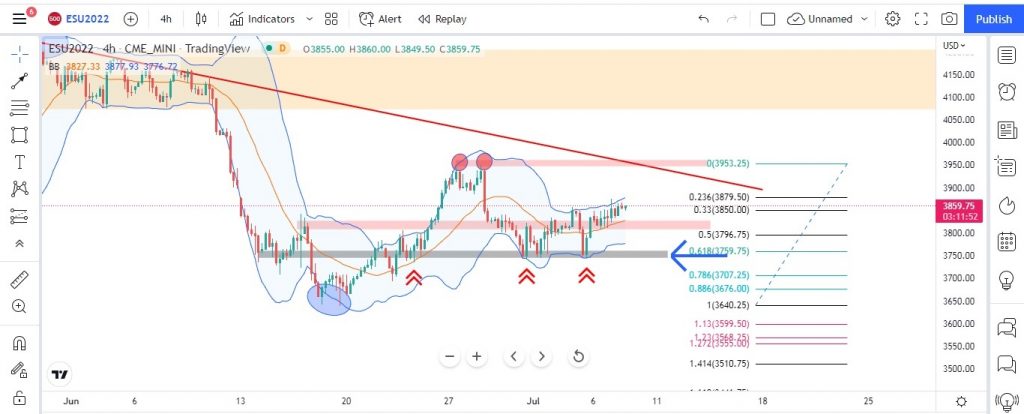
Below chart of ES is on 4 hours time frame with buying setup explaining using price action; trend line; support & resistance; RSI & Fibo ratios. Currently, one can go long at current market price of 3,854 with strict stop loss of 3,744 (Since we are trading against the main trend which is bearish on a higher time frame). One can look for a multiple targets of 1:1; 1:2 & 1:3 risk to reward ratios (Target 1: 3,972; Target 2: 4,086 and Target 3: 4,231). Please, note as soon as buy trade gets executed, and start in one’s favor one has to start trailing the stop loss and one can book 50% of their quantities at 1:1 RRR and next 25% one can book at 1:2 RRR and rest 25% can be book at 1:3. Since the final target of the breakout is coming out at this level of 4,231.
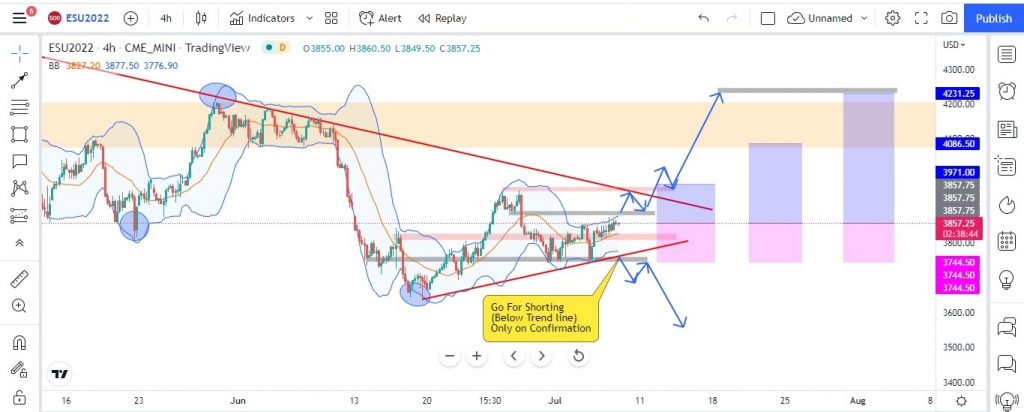
One can initiate a short position only when the below trend line is broken (red color) and only upon confirmation. Currently, if we observe the Bollinger band, the prices are trading on the upper channel which indicates a short term bullishness in the ES September contract, also the prices are in the BB Squeeze, which is indicating that a possible momentum is about to come. The price of ES has multiple resistance as barrier on the upper levels. The more the prices trading in the range 3,950 to 3,750 there is a great changes for a big upcoming momentum in the ES in the near future. From the chart one can see a triangle pattern and RSI on a daily time frame is at 57, breakout of which may give a good momentum in ES.
Please note, the above buy set up is only for risky trader since the main trend is downwards and we are trading against the main trend. The reason for giving buy set up at current levels is because the risk to rewards is best suiting at current positions.
E-MINI NASDAQ FUTURES (ES) –SEP 2022: UPDATES AS ON 20th JULY 2022
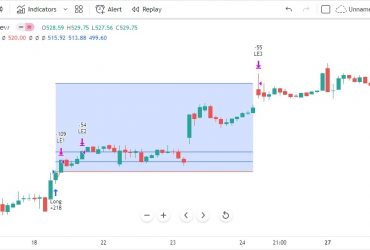
As per our previous analysis we have given a buy call at $ 3,854 level with stop loss at $ 3,744. As on 13th July the major inflation data has came out and market became volatile because of which our stop loss got triggered. As soon as our stop loss triggered the market gave a false breakdown and prices of ES got bounced exactly from our stop loss level. Reason is the RSI gave us the hidden bullish divergence (shown in red color arrow in RSI chart) and prices trapped majority of the sellers and bounced upside. Below is the updated chart of ES for September contract plotted on 4 hour time frame.
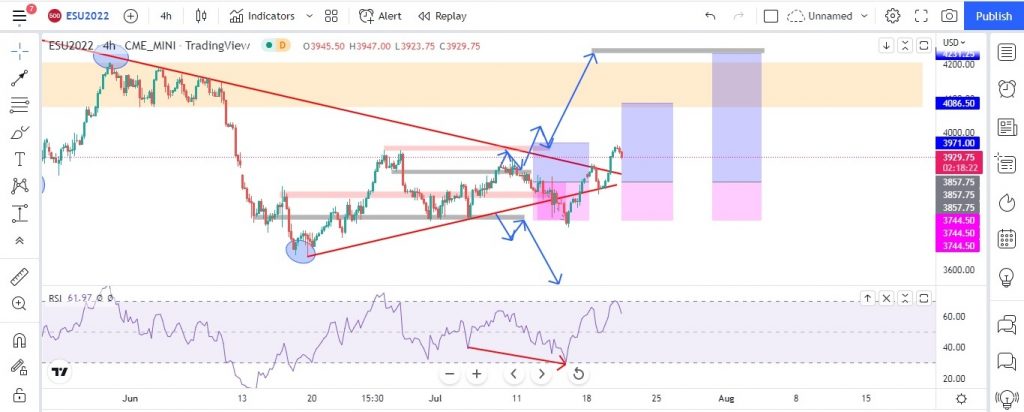
One can still initiate a buy at $ 3,857 levels (or breakout of last swing high with last swing low as stop loss) with stop loss remain same at $ $3,744 with targets of 1:1/1:2/1:3 or $ 3,971; $ 4,086 and $ 4,231.
Website Disclaimer
The Articles published in Blog sections of HFT Solutions, is for educational purpose only and the author is not a SEC registered analyst. The views and opinions expressed on this website are solely those of the original author(s) and other contributor(s). These views and opinions do not necessarily represent those of HFT Solutions, the https://hftsolution.com/ staff, and /or any/all contributors to this site.
All information on the Site is provided in good faith, however we make no representation or warranty of any kind, express or implied, regarding the accuracy, adequacy, validity, reliability, availability, or completeness of any information on the site. UNDER NO CIRCUMSTANCE SHALL WE HAVE ANY LIABILITY TO YOU FOR ANY LOSS OR DAMAGE OF ANY KIND INCURRED AS A RESULT OF THE USE OF THE SITE OR RELIANCE ON ANY INFORMATION PROVIDED ON THE SITE. YOUR USE OF THE SITE AND YOUR RELIANCE ON ANY INFORMATION ON THE SITE IS SOLELY AT YOUR OWN RISK.