Amazon dot com is one of the big five American information technology companies, alongside Alphabet, Apple, Meta and Microsoft. Amazon during the year 2015 when it was trading at $ 15 has performed quite well and made a high during the year 2021 of $ 188. One can see from the below chart, as it is clearly in uptrend holding the simple moving average of 100 plotted on a weekly chart. It took multiple supports at the simple moving average.
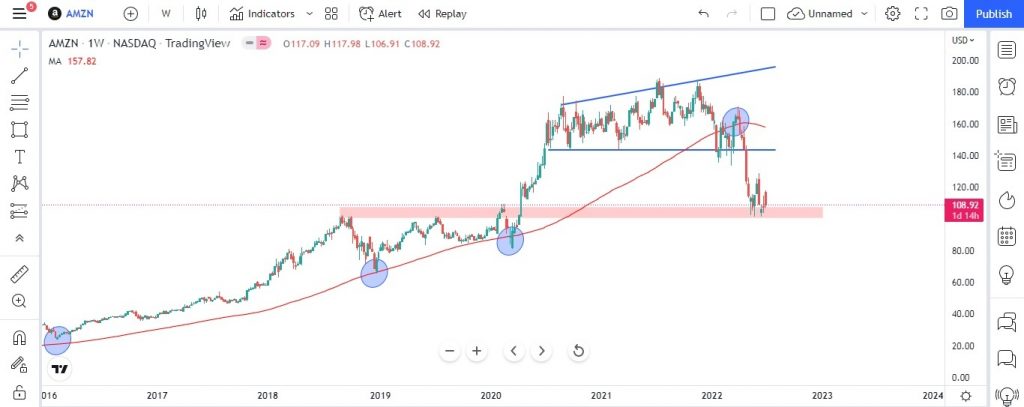
The prices of Amazon starting from 2021 till 2022 was in a broadening wedge bearish channel (An ascending broadening wedge is a bearish chart pattern (said to be a reversal pattern). It is formed by two diverging bullish lines. An ascending broadening wedge is confirmed / valid if it has good oscillation between the two upward lines. The upper line is the resistance line; the lower line is the support line). Below figure shows the bearish ascending broadening wedge on a daily time frame with SMA -100.
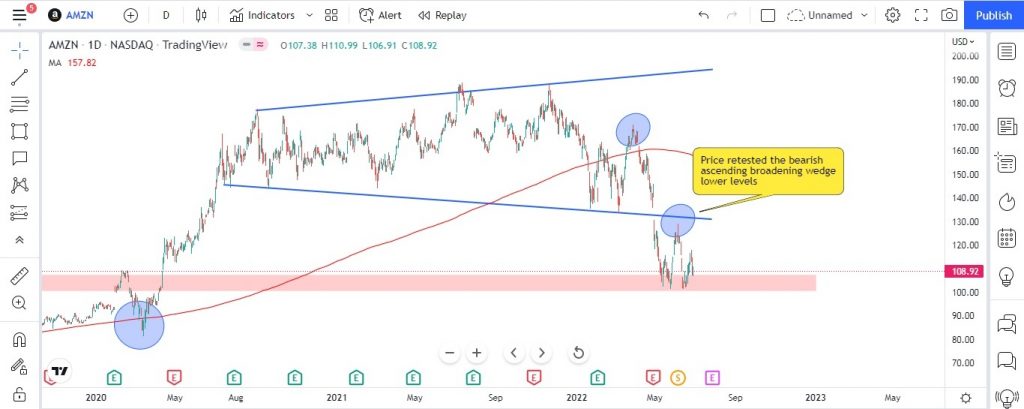
It broke the SMA -100 which was keeping the price of Amazon in bull territory on 18th Jan 2022. The prices retested the SMA -100 levels, finally entering in the bear market. Before breakout, we got two confirmation one from the broadening wedge bearish channel pattern and another SMA -100 days. At present, the Amazon is taking a strong support at zone $ 100 to 108. If prices breach the support levels one can expect further fall in the prices of the Amazon for which we need to get confirmation. Below chart explains (Daily time frame) the possibilities of Amazon price behavior. Also, one can see if we draw the Fibo on the chart. It took exactly support at 78% of Fibo levels which is $ 102.
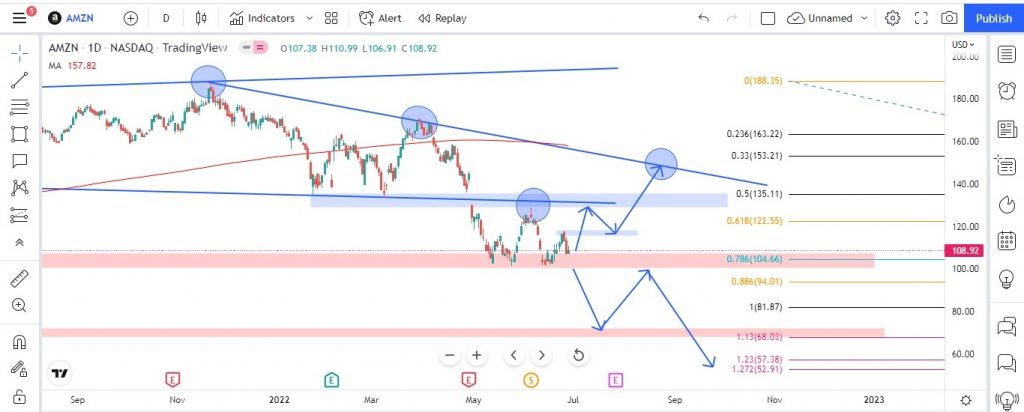
The blue arrow indicates the possible price action that the Amazon can make, based on simple using Fibo + price action + Support & Resistance + Trend line concepts. The support zone (red zone) has been tested multiple times; hence there is a possibility of breaking on the lower side. If broken on lower side the price may head towards the range of $ 68 -$72. Another possibility might be price may take once again the support at current levels and heads towards the 51% of Fibo levels. Currently, the price zone between $ 100 to $ 130 is a consolidation zone at the higher time frame. One can expect a big rally above or below these levels.
If an investor wants to buy Amazon they can buy at current prices with 25% of their total allocated capital. If price breaks the support level they can average around at price range between $ 80 -$ 90 by adding another 50% of their allocated capital and rest 25% can be added at levels $ 68 -$72. With a strict Stop loss of $ 60. Current level for buying is suggested, the reason is Amazon fell nearly 44% from its all time high ($ 188). Any fall in price of a stock which is nearly 50% of its all time high is a good opportunity to invest and also there is a possibility of prices to retest the all time high.
NASDAQ -100 INDEX (AMZN): UPDATES AS ON 13th JULY 2022
As updated in our previous analysis for Amazon dot com the prices took support at the same level of 78% of Fibo which is $ 104.66 and we did see the bounce all the way till the blue rectangle box which was our resistance zone of $ 115.82 and reversed exactly from the resistance zone. Below is the updated chart of Amazon on a 4 hours time frame as on 13th June 2022.
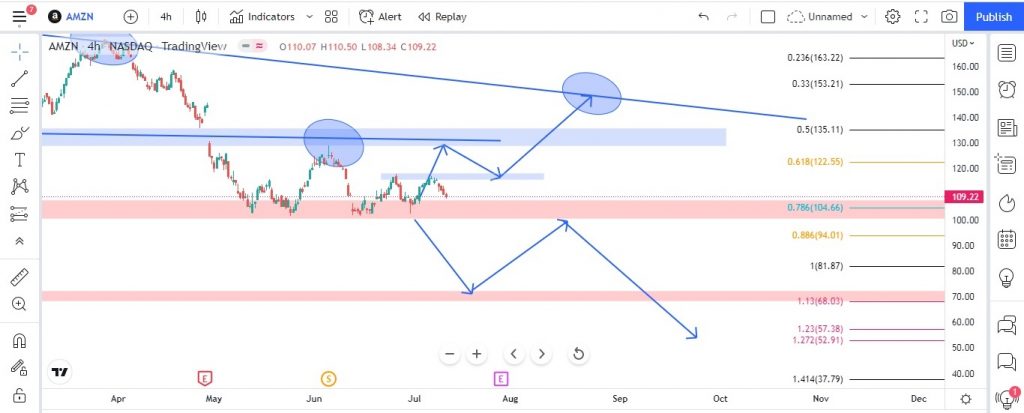
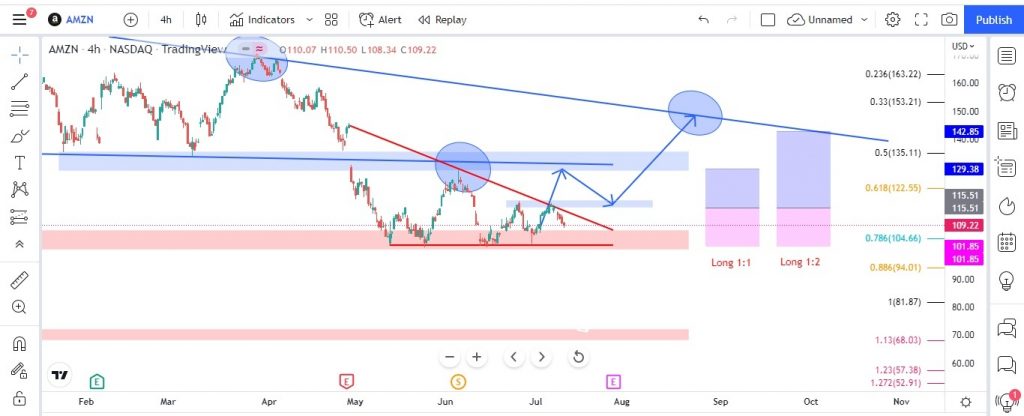
At present scenario, the prices of Amazon are trading in a triangle pattern. Below chart of Amazon is on a 4 hours time frame with trend lines drawn in red color. The chart explains the probability of buy set up and the details are as follows:
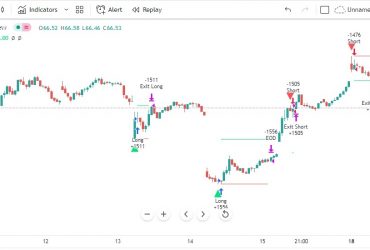
- BUY SETUP 1: Buy at $ 115.51 with stop loss at $101.85 with a target of 1:1 or $ 129.38 provided the prices must give a breakout of above trend line and prices needs to retest the $ 115.51 with good volume confirmation.
- BUY SETUP 2: Buy at $ 115.51 with stop loss at $101.85 with a target of 1:2 or $ 142.85 provided the prices must give a breakout of above trend line and prices needs to retest the $ 115.51 with good volume confirmation.
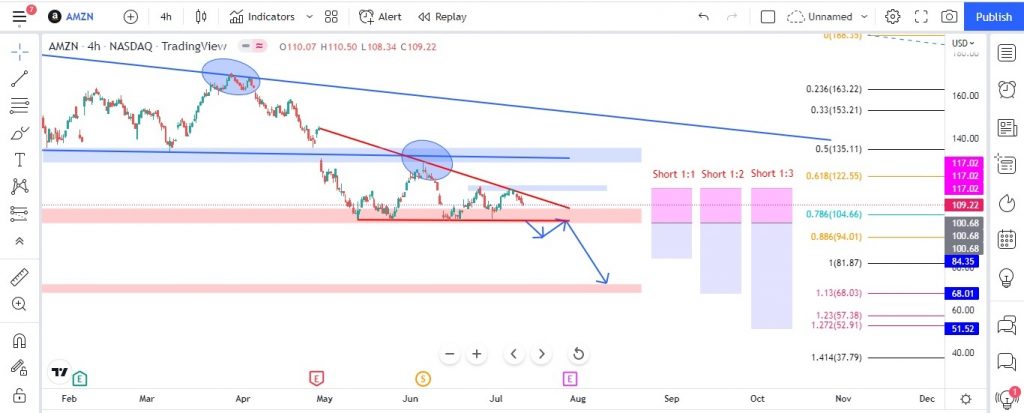
Below chart of Amazon is plotted on 4 hours time frame shows the probability of sell set up with proper risk to reward ratios and details of sell setup are:
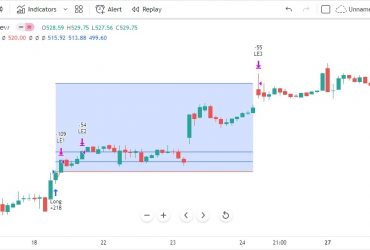
- SELL SETUP 1: Sell at $ 100.68, with stop loss being placed at $ 117.02 with target of 1:1 or $ 84.35. One can initiate a sell position only when prices of Amazon breaks the lower trend line with good volume and retest the level of $ 100.68.
- SELL SETUP 2: Sell at $ 100.68, with stop loss being placed at $ 117.02 with target of 1:2 or $ 68.01. One can initiate a sell position only when prices of Amazon breaks the lower trend line with good volume and retest the level of $ 100.68.
- SELL SETUP 3: Sell at $ 100.68, with stop loss being placed at $ 117.02 with target of 1:3 or $ 51.52. One can initiate a sell position only when prices of Amazon breaks the lower trend line with good volume and retest the level of $ 100.68.
Website Disclaimer
The Articles published in Blog sections of HFT Solutions, is for educational purpose only and the author is not a SEC registered analyst. The views and opinions expressed on this website are solely those of the original author(s) and other contributor(s). These views and opinions do not necessarily represent those of HFT Solutions, the https://hftsolution.com/ staff, and /or any/all contributors to this site.
All information on the Site is provided in good faith, however we make no representation or warranty of any kind, express or implied, regarding the accuracy, adequacy, validity, reliability, availability, or completeness of any information on the site. UNDER NO CIRCUMSTANCE SHALL WE HAVE ANY LIABILITY TO YOU FOR ANY LOSS OR DAMAGE OF ANY KIND INCURRED AS A RESULT OF THE USE OF THE SITE OR RELIANCE ON ANY INFORMATION PROVIDED ON THE SITE. YOUR USE OF THE SITE AND YOUR RELIANCE ON ANY INFORMATION ON THE SITE IS SOLELY AT YOUR OWN RISK.