Tesla Inc. designs, manufactures, and sells high-performance electric vehicles, battery and electric vehicle power train components. The Company owns its sales and service network and sells electric power train components to other automobile manufacturers. Tesla serves customers worldwide. Tesla launched its IPO on June 29, 2010. Trading on the NASDAQ, Tesla offered 13.3 million shares at a price of $17 per share. It raised a total of just over $226 million. Tesla’s stock price was essentially flat for several years after the 2010 IPO. There wasn’t a lot going on. Tesla’s stock price started gaining momentum from October 2019; below chart explain Tesla performance on a weekly time frame. One can clearly see the momentum started picking up after 2019, when price of Tesla cross over simple moving average (SMA -50). Tesla stock price took multiple supports at 50 SMA to outperform. The stock made an all time high of $1,243 on 1st November 2021. Currently, the stock price of Tesla is trading in a channel (See below chart –Channel).
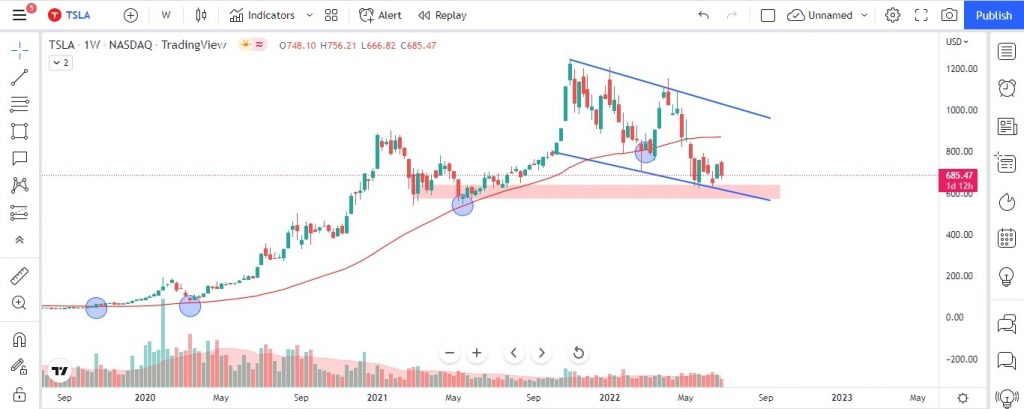
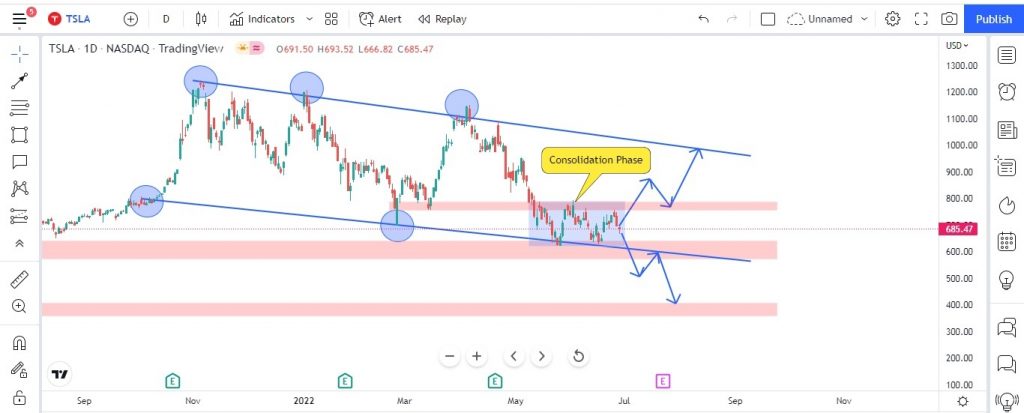
Tesla stock price broke the SMA -50 on 9th may 2022, currently the prices are in a consolidation phase. The price took support at the very crucial level of $ 640. Presently, one can see there is a double bottom formation at the support zone (the support zone is shown in red color-horizontal box). Also if we look at the Bollinger Band (See below chart), the upper & lower band, and the contraction (Price Squeeze) is taking place. This means one can expect a sharp momentum once the prices break the consolidation phase. The prices can move in either direction. If prices, breaks on upper band, the prices may test $ 850 to $ 880 levels, before heading towards the upper channel of the weekly time frame, which will be the key resistance area. If prices, breaks on lower band, the prices may test $ 360 to $ 410.
Below chart explains with blue channel along with Bollinger band for Tesla Inc., on a daily time frame.
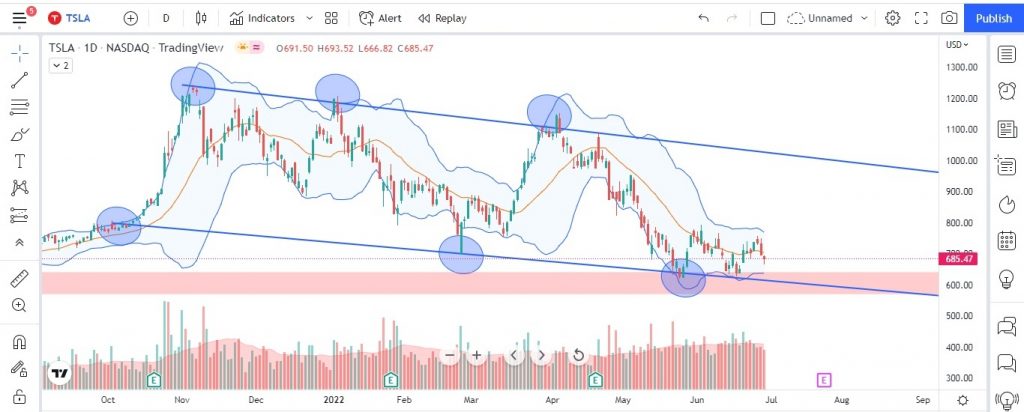
From the above chart, if we see the volume expansion, there is no clear cut average volume expansion happening at the moment. Once the price breaks the consolidation zone, we need to see the volume expansion for our confirmation. The possible moves the price can make is explained in the below chart on a daily time frame with blue arrow. One can initiate a trade only after the prices breakout of the consolidation zone and with proper confirmation. Until then its wait and watch mode for traders. However, if one trades in options they can initiate a CALL & PUT sell orders provided with proper stop loss or they can hedge with future position with CALL & PUT options.
NASDAQ -100 INDEX –TESLA (TSLA): UPDATED AS ON 13th JULY 2022
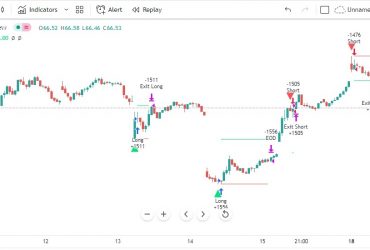
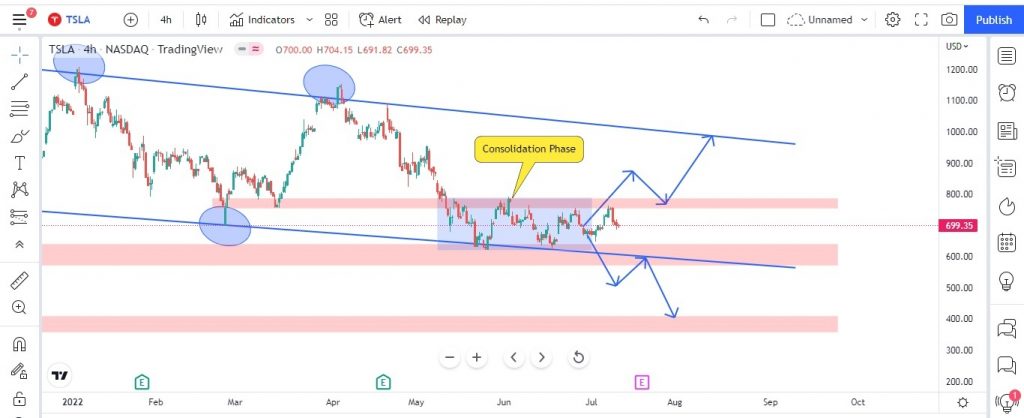
As mentioned in our previous analysis on TESLA the prices of TESLA is in a consolidation phase and it continued till today that is on 13th July 2022 in a consolidation phase. Below chart of Tesla is on a 4 hour time frame updated as on 13th July 2022. Please, note there is a major inflation data which is yet to come on 13th July & only after that market may show some volatile movements & sets a new direction.
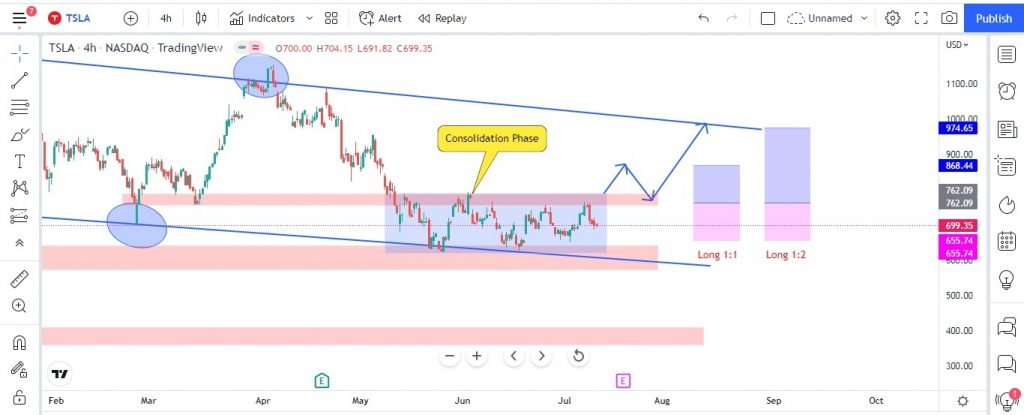
Below chart of Tesla is on a 4 hours time frame showing probability of buy set up along with proper risk to reward ratio. The details of buy set up are as follows:
- BUY SETUP 1: Buy at $ 762.09 with stop loss at $ 655.74, with target of 1:1 or $ 868.44. Buy only after the breakout of the consolidation phase (shown in blue arrow) and allow the prices to retest the consolidation zone along with volume confirmation.
- BUY SETUP 2: Buy at $ 762.09 with stop loss at $ 655.74, with target of 1:2 or $ 974.65. Only on confirmation as explained above.
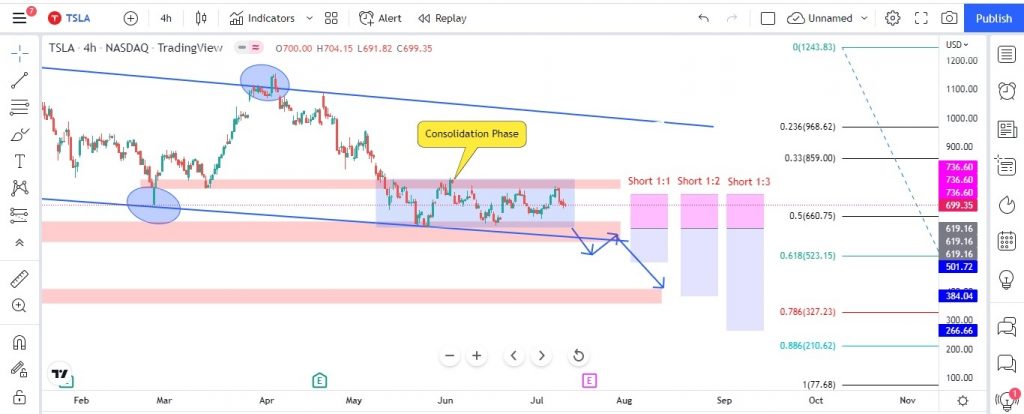
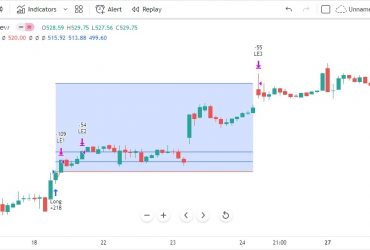
Above chart of Tesla is on a 4 hours time frame showing probability of sell set up along with proper risk to reward ratio. The details of sell set up are as follows:
- SELL SETUP 1: Sell at price $ 619.16 with stop loss at $ 736.60 and with target of 1:1 or $ 501.72. Sell only on breakdown of trend line and only after pullback to level $ 619.16 with volume confirmation.
- SELL SETUP 2: Sell at price $ 619.16 with stop loss at $ 736.60 and with target of 1:2 or $ 384.04. Sell only on breakdown of trend line and only after pullback to level $ 619.16 with volume confirmation.
- SELL SETUP 3: Sell at price $ 619.16 with stop loss at $ 736.60 and with target of 1:3 or $ 266.66 Sell only on breakdown of trend line and only after pullback to level $ 619.16 with volume confirmation.
Website Disclaimer
The Articles published in Blog sections of HFT Solutions, is for educational purpose only and the author is not a SEC registered analyst. The views and opinions expressed on this website are solely those of the original author(s) and other contributor(s). These views and opinions do not necessarily represent those of HFT Solutions, the https://hftsolution.com/ staff, and /or any/all contributors to this site.
All information on the Site is provided in good faith, however we make no representation or warranty of any kind, express or implied, regarding the accuracy, adequacy, validity, reliability, availability, or completeness of any information on the site. UNDER NO CIRCUMSTANCE SHALL WE HAVE ANY LIABILITY TO YOU FOR ANY LOSS OR DAMAGE OF ANY KIND INCURRED AS A RESULT OF THE USE OF THE SITE OR RELIANCE ON ANY INFORMATION PROVIDED ON THE SITE. YOUR USE OF THE SITE AND YOUR RELIANCE ON ANY INFORMATION ON THE SITE IS SOLELY AT YOUR OWN RISK.