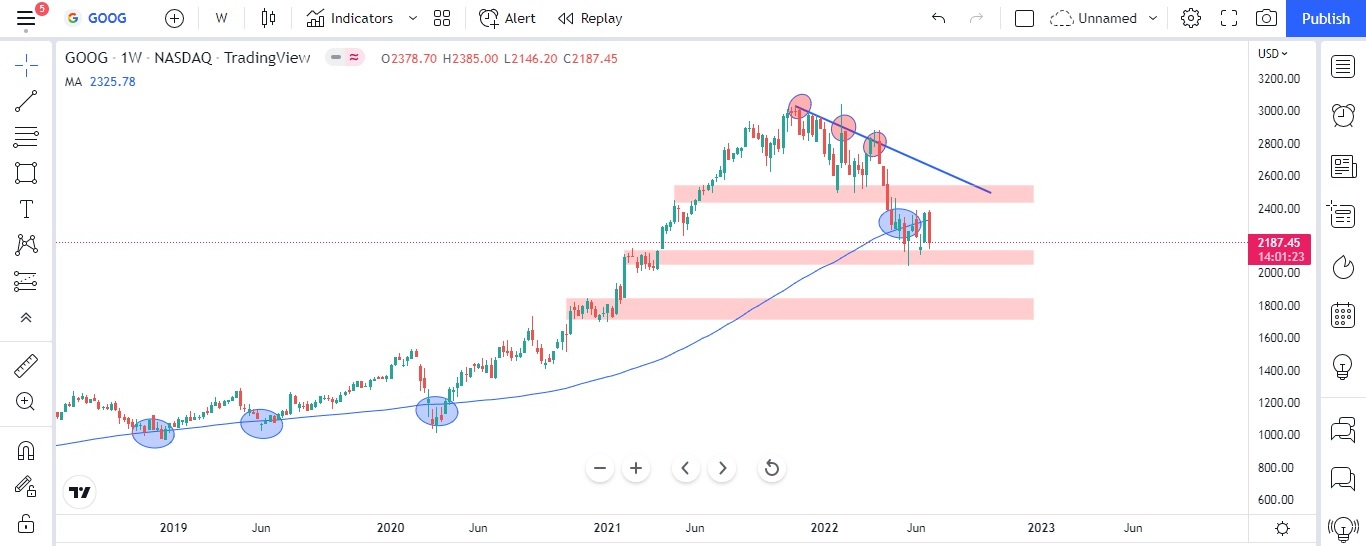
Alphabet Inc. (GOOG) is an American multinational technology conglomerate holding company headquartered in Mountain View, California. Alphabet is the world’s third –largest technology company by revenue and one of the world’s most valuable companies. It is one of the Big Five American Information Technology companies, alongside Amazon, Apple, Meta & Microsoft. Google has outperformed in just 3 years starting from 2019 to 2021 by making an all time high from $ 970 to $ 3042 which is about 210% from the year 2019. From the below chart, one can clearly see that the stock price of Google has taken multiple support at Simple Moving Average of 100 on a weekly time frame.
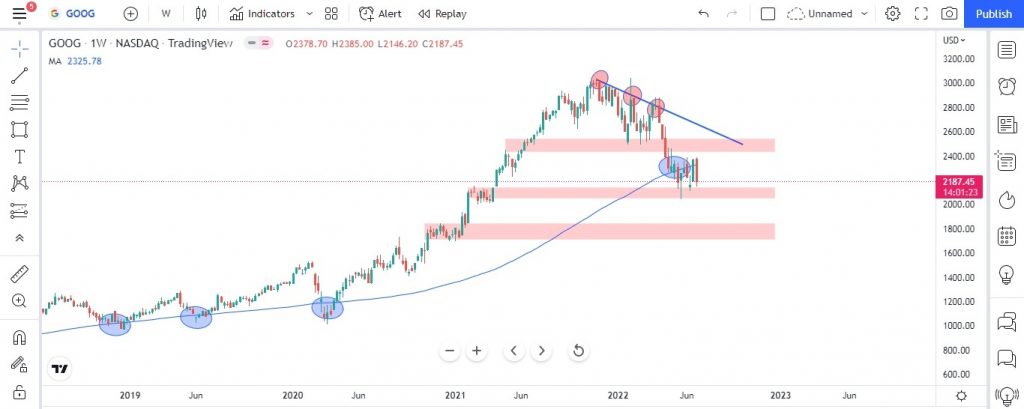
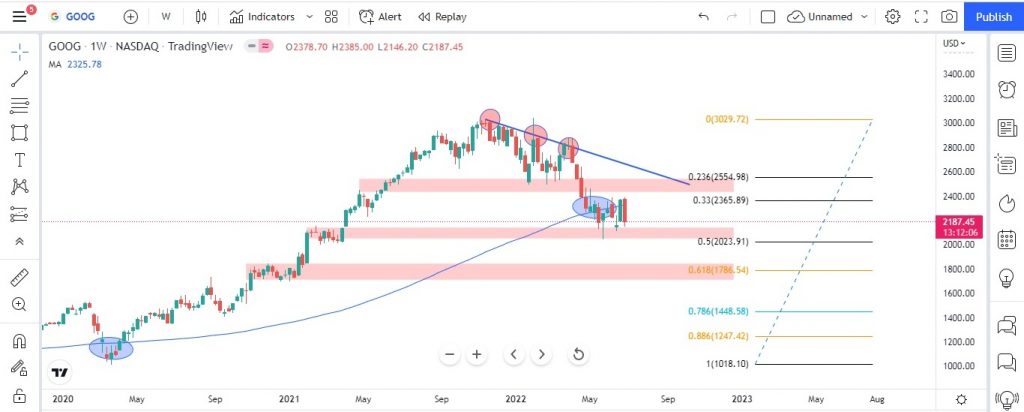
Google stock after making all time high, it has faced multiple rejections from higher price, and this can be seen by drawing a simple trend line from the peak point of the stock. The blue trend line is drawn by connecting two peak points and the red circle explains the rejection from the trend line. Now the rectangle box (top 1st) it has taken support and finally even that support was broken, which is a sign of bearishness in the stock. From the chart we can also see that the stock price failed to make higher high and broke the support level and now it has also broken the Simple Moving Average (100) also.
If we draw the Fibo levels starting from 2020 till the peak of the stock price, we can see that the prices of the stock has fallen nearly 32% from its peak and also we can see it has taken support at a crucial level of 51% of Fibo. At present the price of the stock is in a consolidation phase, we need to get a confirmation once the price breaks the consolidation area. If price breaks downside, there will be more downfalls in the stock prices. If it breaks on the upper side, which will act as a retracement for the bearish phase and also it will be the first retracement for the downward impulse move. Below chart explains using the Fibo levels.
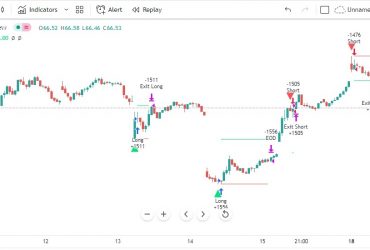
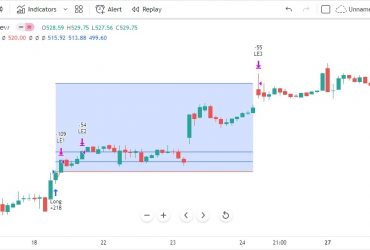
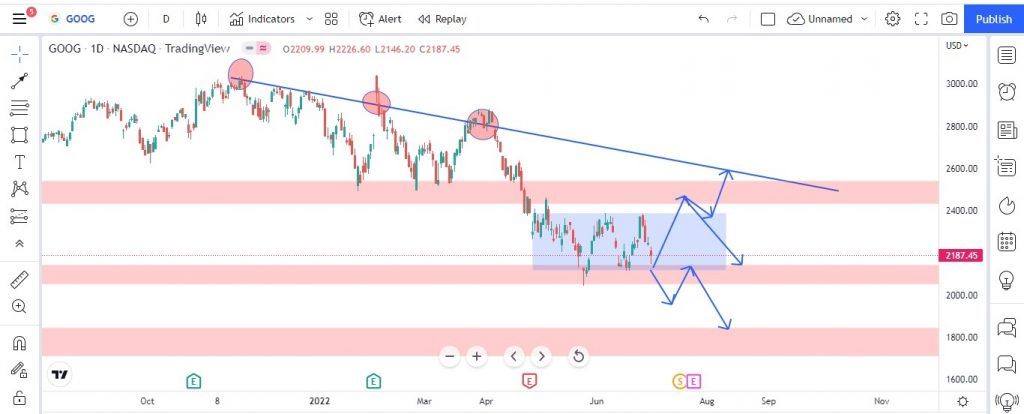
The possible price action that can happen in the stock is explained in the below chart on a daily time frame. Here the blue rectangle box is the consolidation phase. The blue arrow indicates the possible direction using support and resistance the price action that may happen. If price breaks the lower side then it can head towards the 61% of the Fibo levels which is $ 1,790 -$ 1,800. If any news like Fed rate cuts and Geo- political tension, the price on the lower side may also test for 78% of Fibo level which is $ 1,453. If price breaks above the possible targets will be $ 2,376 to $ 2,567.
Website Disclaimer
The Articles published in Blog sections of HFT Solutions, is for educational purpose only and the author is not a SEC registered analyst. The views and opinions expressed on this website are solely those of the original author(s) and other contributor(s). These views and opinions do not necessarily represent those of HFT Solutions, the https://hftsolution.com/ staff, and /or any/all contributors to this site.
All information on the Site is provided in good faith, however we make no representation or warranty of any kind, express or implied, regarding the accuracy, adequacy, validity, reliability, availability, or completeness of any information on the site. UNDER NO CIRCUMSTANCE SHALL WE HAVE ANY LIABILITY TO YOU FOR ANY LOSS OR DAMAGE OF ANY KIND INCURRED AS A RESULT OF THE USE OF THE SITE OR RELIANCE ON ANY INFORMATION PROVIDED ON THE SITE. YOUR USE OF THE SITE AND YOUR RELIANCE ON ANY INFORMATION ON THE SITE IS SOLELY AT YOUR OWN RISK.