Silver futures and options contracts are used by mining companies, fabricators of finished products, and users of silver-content industrial materials to manage their price risk. As a precious metal, silver also plays a role in investment portfolios. The largest industrial users of silver are the photographic, jewelry, and electronic industries. The biggest producers of silver are: Mexico, Peru and China followed by Australia, Chile, Bolivia, United States, Poland and Russia. Silver being a precious metal it is traded in price per troy ounce in USD.
Below chart of silver is on a weekly time frame plotted with Simple Moving Average (SMA -200). One can also see the price of silver is trading in a channel (two blue lines). When price of silver crossed the SMA -200 line, the price of silver was trading at $ 12.5/OZ (April 2009) and rallied up to $ 49.83 /OZ (April 2011). During, the pandemic most of the investor invested their capital either in gold or silver and one can see from the below chart the price of silver took support just below the SMA-200 and it did not cross the low of 2009. That is where most of the investor invested since the prices at that moment was trading at nearly 10 years low and there was a dropped down of almost 75% in the prices of silver.
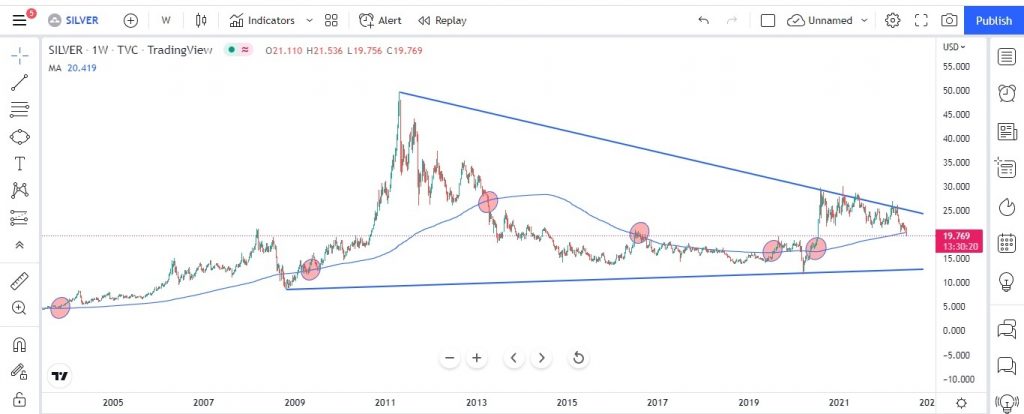
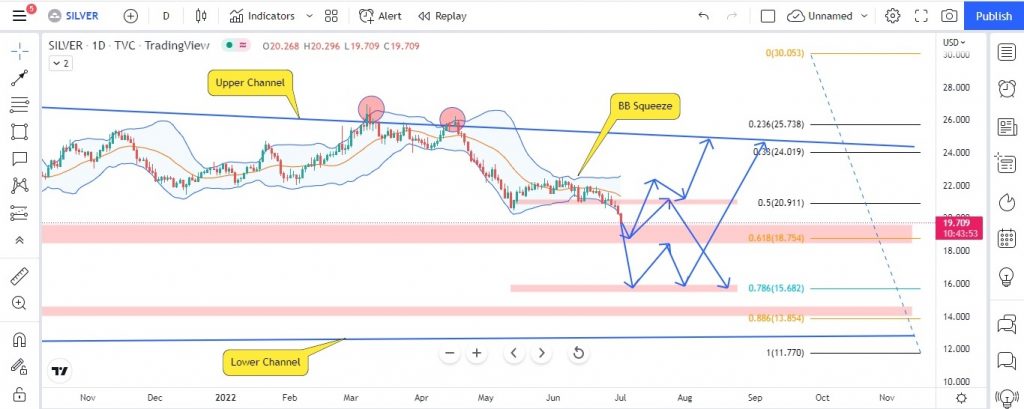
If we draw the two lows starting from 2009 to 2020 and if we draw the trend line from peak of 2011 to peak of 2020, we can clearly see the prices of silver are trading in a neutral symmetrical triangle and can give breakout on either side. If we plot the Fibo starting from peak of 2011 to low of 2020, then we can see that the prices are being rejected at the 51% of Fibo levels which is $ 30.91/OZ. If we plot the silver on a daily time frame to watch out for possible support and resistance, below chart explains in details about the key support & resistance levels for silver on a daily time frame. For our analysis we have included Bollinger Bands along with Fibo levels.
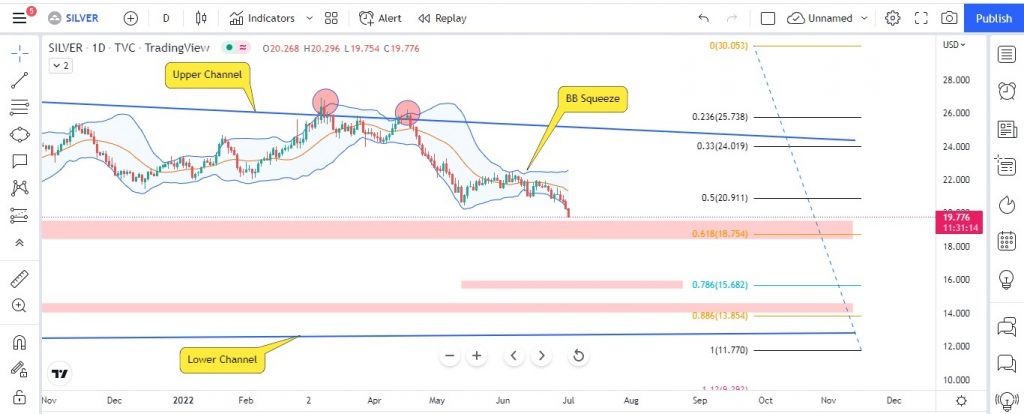
Prices of silver made a double top exactly at the top trend line before breaking down. Also we have drawn the Fibo levels based on low of 2020 (last swing low) and high of 2020 (last swing high). One can see that prices are trading below the 51% of Fibo levels and are heading towards the 61% of Fibo levels which is also our support area for silver. If prices of silver broke the 61% of Fibo levels then it may fall further to 78% where investor can look for good opportunity for buying at $ 15.68/OZ. Since, the prices of the silver have broken the BB Squeeze, for next few days the prices may be trending and may be more volatile. Below chart explains the possible price action one can expect from the silver it is drawn using blue arrow on a daily time frame.
Website Disclaimer
The Articles published in Blog sections of HFT Solutions, is for educational purpose only and the author is not a SEC registered analyst. The views and opinions expressed on this website are solely those of the original author(s) and other contributor(s). These views and opinions do not necessarily represent those of HFT Solutions, the https://hftsolution.com/ staff, and /or any/all contributors to this site.
All information on the Site is provided in good faith, however we make no representation or warranty of any kind, express or implied, regarding the accuracy, adequacy, validity, reliability, availability, or completeness of any information on the site. UNDER NO CIRCUMSTANCE SHALL WE HAVE ANY LIABILITY TO YOU FOR ANY LOSS OR DAMAGE OF ANY KIND INCURRED AS A RESULT OF THE USE OF THE SITE OR RELIANCE ON ANY INFORMATION PROVIDED ON THE SITE. YOUR USE OF THE SITE AND YOUR RELIANCE ON ANY INFORMATION ON THE SITE IS SOLELY AT YOUR OWN RISK.