The EUR/USD (or Euro Dollar) currency pair belongs to the group of ‘Majors’, a way to mention the most important pairs in the world. The popularity of Euro Dollar is due to the fact that it gathers two main economies: Europe and the United States of America. This is a widely traded currency pair where the Euro is the base currency and the US Dollar is the counter currency. Since the EUR/USD pair consists of more than half of all the trading volume worldwide in the Forex Market, it is almost impossible for a gap to appear, let alone a consequent breakaway gap in the opposite direction.
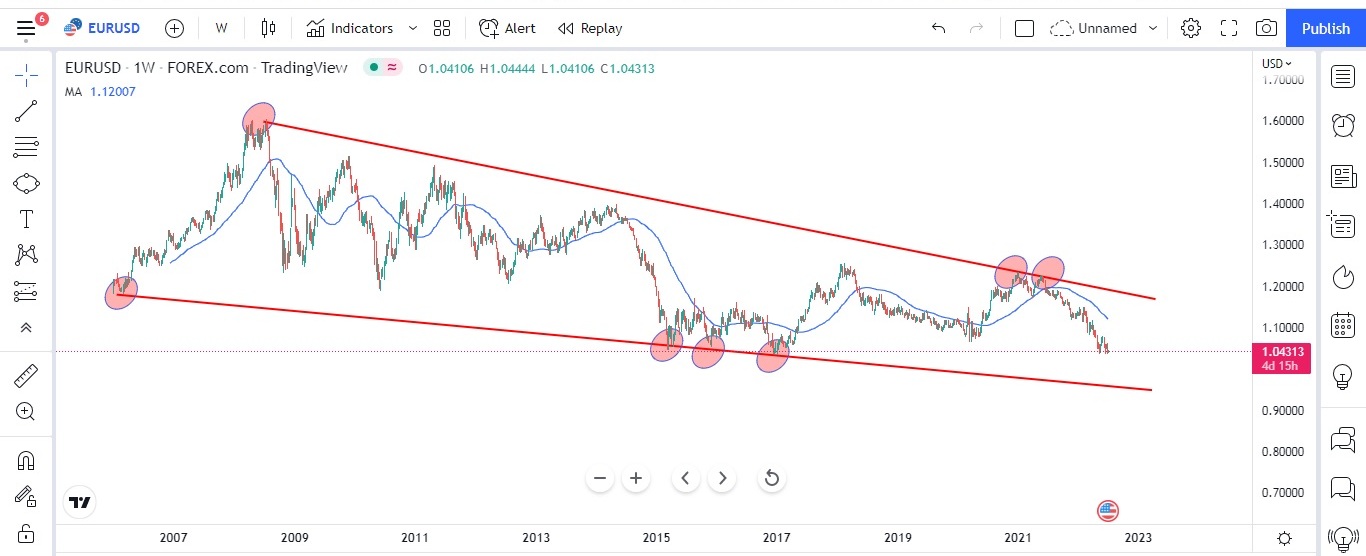
Below chart illustrates the EUR/USD on a weekly time frame. Starting from 2007 the currency pair was doing extremely well until 2009 beginning. During the recession in 2008 -2009, it has affected the performance of the EUR/USD to a great extent and we can clearly see the performance is not that great since the prices are making lower low and higher low over the last decade. If we plot a Simple moving average (SMA-50) on a weekly time frame, the current prices are below the SMA. Also, one can see the price of EUR/USD are trading in a wider triangle chart pattern and currently is trading at the crucial support levels.
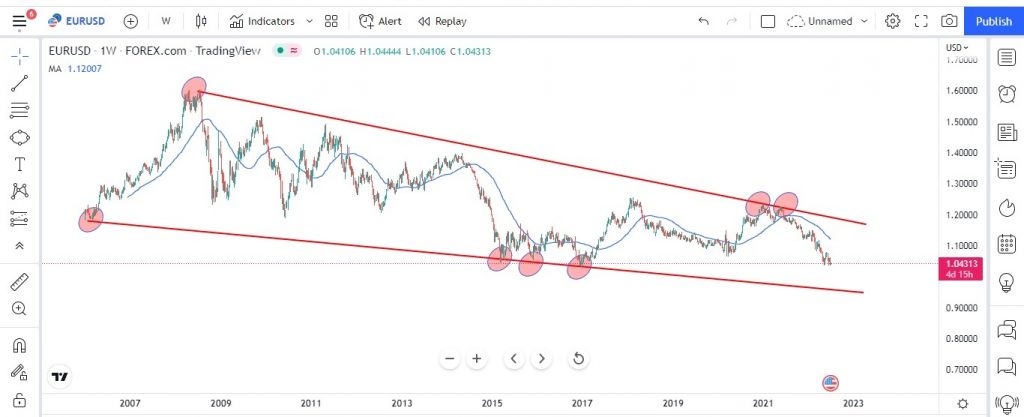
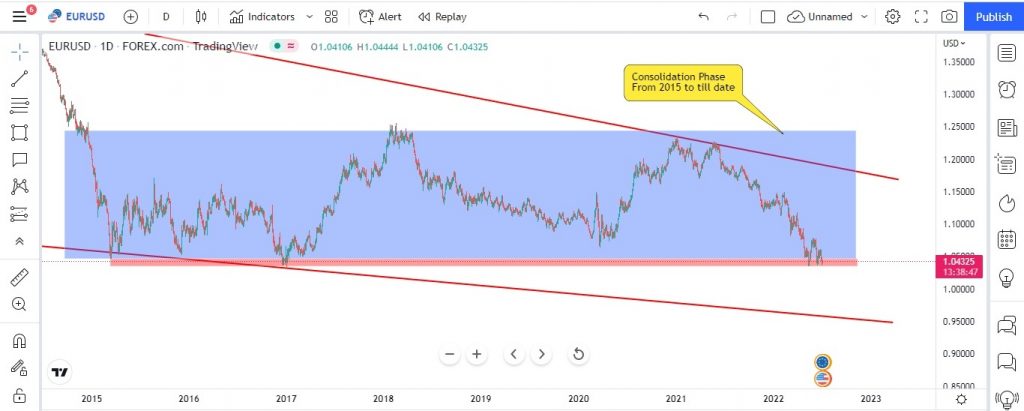
If price breaks the support which is a crucial support for EUR/USD (1.3080) and also it is the low since 2017. It will be the worst performer since starting 2007 (which means prices will be trading at all time low). Below chart explains the EUR/USD on a daily time frame. One can clearly see the prices are in a consolidation phase starting from year 2015 to till date in a rectangle blue box. The red rectangle box is the crucial support zone for the price to take support. If prices breach the key support level it can head towards the red trend line which is 0.95863 levels.
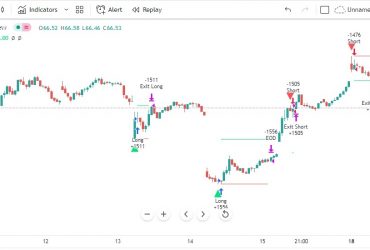
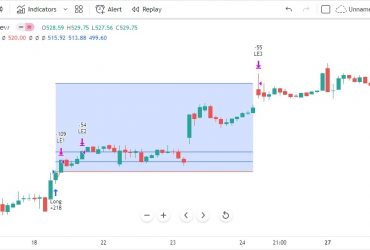
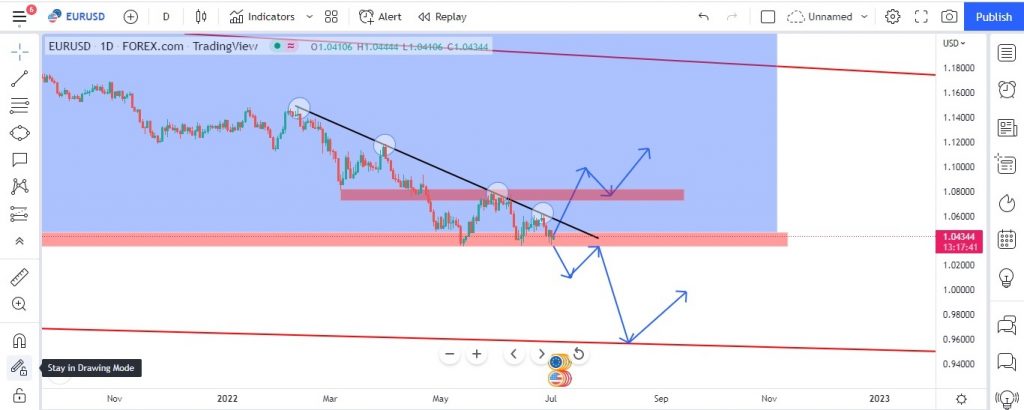
Due to high inflation worldwide, Fed rate cuts are on the cards and also Geo political tension may have a severe affect on EUR/USD in the coming days. Below chart explains (blue arrows) the possible price action move one can expect in the EUR/USD on a daily time frame. At present the RSI on a daily time frame is taking support at 41 levels, which indicates a possible short term uptrend in the EUR/USD. However, one must note that the main trend is still downtrend and we need proper confirmation to go long. Better strategy at this moment would be Sell on Rise (SOR) or would wait for key support to break to go for short position. If one plan to take a long position wait for trend line (black line) to cross with volume confirmation and look for a target of 1.08000 which is also the red zone (key resistance zone).
Website Disclaimer
The Articles published in Blog sections of HFT Solutions, is for educational purpose only and the author is not a SEC registered analyst. The views and opinions expressed on this website are solely those of the original author(s) and other contributor(s). These views and opinions do not necessarily represent those of HFT Solutions, the https://hftsolution.com/ staff, and /or any/all contributors to this site.
All information on the Site is provided in good faith, however we make no representation or warranty of any kind, express or implied, regarding the accuracy, adequacy, validity, reliability, availability, or completeness of any information on the site. UNDER NO CIRCUMSTANCE SHALL WE HAVE ANY LIABILITY TO YOU FOR ANY LOSS OR DAMAGE OF ANY KIND INCURRED AS A RESULT OF THE USE OF THE SITE OR RELIANCE ON ANY INFORMATION PROVIDED ON THE SITE. YOUR USE OF THE SITE AND YOUR RELIANCE ON ANY INFORMATION ON THE SITE IS SOLELY AT YOUR OWN RISK.