The USD/JPY (or US Dollar Japanese Yen) currency pair belongs to the group of ‘Major’s’, a way to mention the most important pairs in the world. USD/JPY is the ticker used to denote the currency exchange rate for the USD and Japanese Yen. Yen has a low –interest rate and is normally used in carrying trades. This is the reason why it is one of the most traded currencies worldwide. In this pair, the US Dollar is the base currency and the Japanese Yen is the counter currency. Also, the pair represents American and Japanese economies. USD/JPY tends to have a positive correlation with USD/CHF because the Yen and the Swiss franc are both currencies traditionally viewed as safe havens by investors.
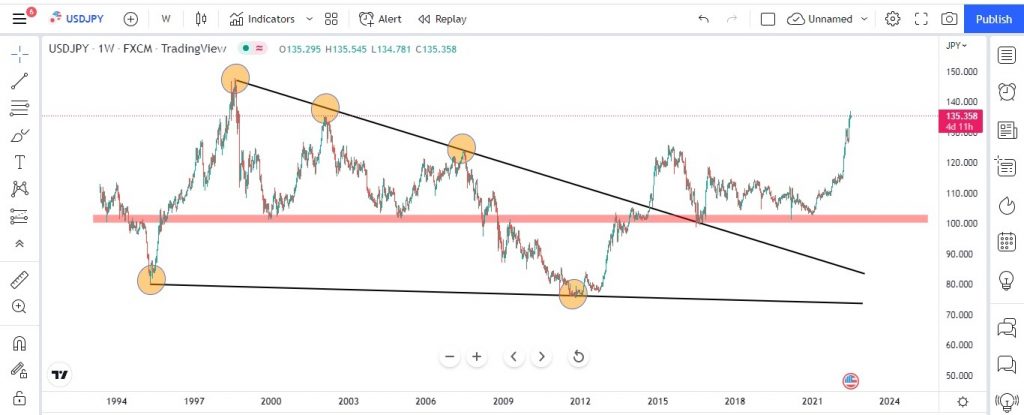
Below chart is of USD/YEN on a weekly time frame. Here we can clearly see the prices are in a symmetrical triangle from the year 1994 to October 2014. It gave a breakout and retested the support zone in the year 2016. Since, then the prices of USD/JPY were in a consolidation phase, before giving another breakout in the year 2021. The upper trend line of symmetrical triangle one can clearly see the prices got rejected multiple times.
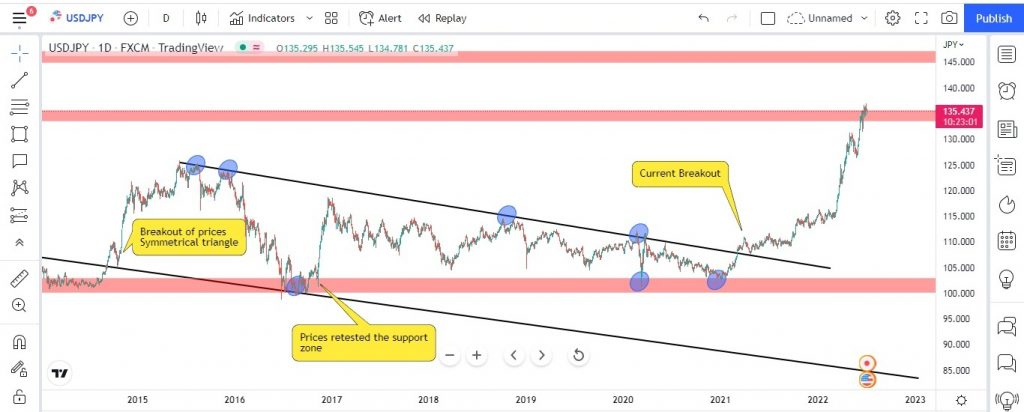
Below chart will explain on a daily time frame, starting from breakout in the year 2014, the prices made a high of 125 before retesting the breakout levels (see below the red support zone, where prices retested). Prices again went into a consolidation phase after giving the breakout starting from the year 2014 to 2021 and once again has given an upside breakout (see black color trend line).
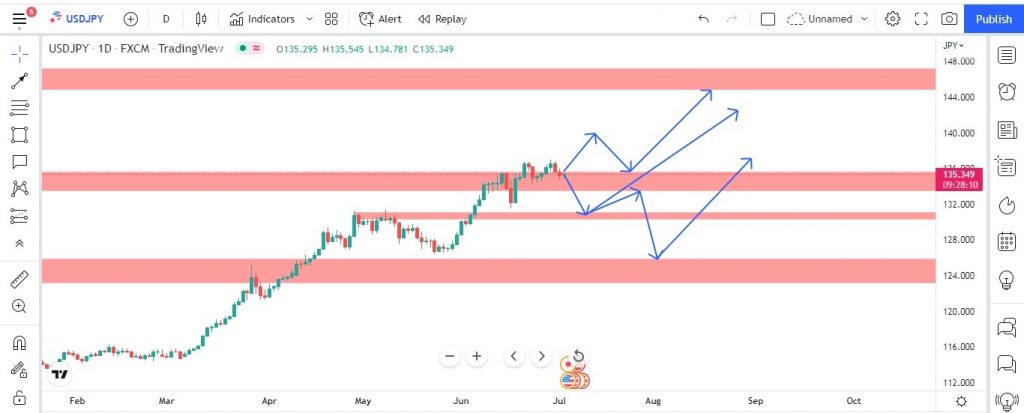
At present scenario, the price is trading at the key resistance zone which is 135. The other key resistance zone for the USD/JPY is at 145 to 147 levels. Any breakout above and prices sustain will make the prices to be in strong bullish zone. Which means the dollars will become stronger as compared to Japanese YEN (also termed as the price of YEN is falling drastically as compared to US Dollars).
Below chart explains the possible USD/JPY price action movement on a daily time frame. The blue arrows indicate the possible price action behavior using support and resistance being draw. If one is going for a short position, they can enter at current levels of 135 with stop loss just above the high of 137 with a target of 1:1 or (131) with strict stop loss trailing. If one is looking for a buy opportunity one can initiate at level 130 -131 levels or breakout of 137 levels. Until, then the buyer has to be in wait and watch mode.
Website Disclaimer
The Articles published in Blog sections of HFT Solutions, is for educational purpose only and the author is not a SEC registered analyst. The views and opinions expressed on this website are solely those of the original author(s) and other contributor(s). These views and opinions do not necessarily represent those of HFT Solutions, the https://hftsolution.com/ staff, and /or any/all contributors to this site.
All information on the Site is provided in good faith, however we make no representation or warranty of any kind, express or implied, regarding the accuracy, adequacy, validity, reliability, availability, or completeness of any information on the site. UNDER NO CIRCUMSTANCE SHALL WE HAVE ANY LIABILITY TO YOU FOR ANY LOSS OR DAMAGE OF ANY KIND INCURRED AS A RESULT OF THE USE OF THE SITE OR RELIANCE ON ANY INFORMATION PROVIDED ON THE SITE. YOUR USE OF THE SITE AND YOUR RELIANCE ON ANY INFORMATION ON THE SITE IS SOLELY AT YOUR OWN RISK.