According to the Bank for International Settlements, GBP/USD is the third most popular forex pair, taking up around 14 percent share of the daily trading volume. The GBP/USD pair represents the relationship between the world’s most influential currencies: the United Kingdom’s pound and the United States’ dollar. The GBP vs. USD chart shows how many US dollars – the quote currency – are needed to buy one pound – the base currency.
Backed by two large economies, both the GBP and the USD are some of the oldest and most traded currencies in the world. Their pairing – one of the forex majors – is also known as the “cable”, referring to the undersea telecoms cables that used to carry GBP/USD bid and ask quotes across the Atlantic Ocean between London and New York.
When trading the GBP/USD forex pair, it is recommended to pay attention to economic releases and changes in monetary policy made by the institutions in control – the Bank of England and the US Federal Reserve. In addition, it is important to consider major economic changes in the UK and the US, including GDP figures, import/export data, inflation rates, employment statistics and inflation rates.
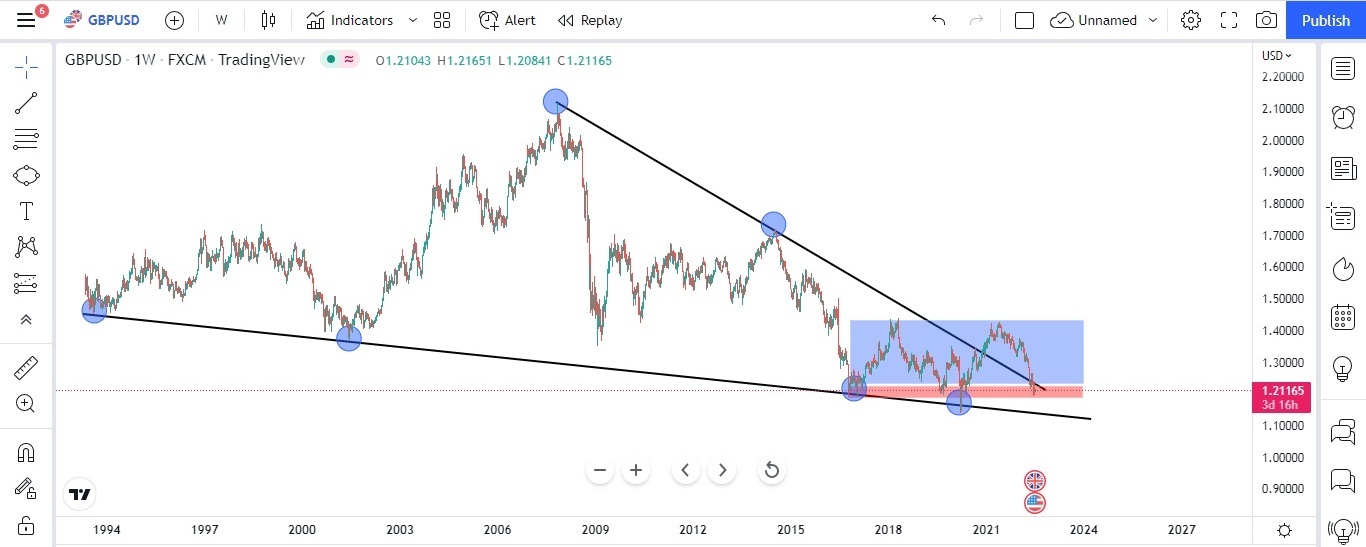
Below chart is for GBPUSD plotted on a weekly time frame. One can see the prices are fluctuating in a descending triangle pattern. Currently the price of GBPUSD is in a consolidation phase which is shown in the blue rectangle box. The key support for GBPUSD is shown in a red rectangle box.
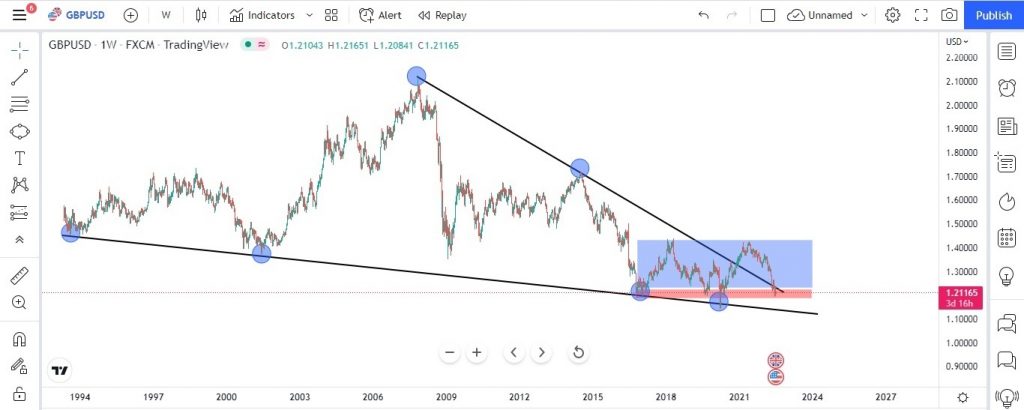
It was during the year 2007 when GBPUSD has outperformed and made an all time high of 2.11612. Since then, the prices are making lower lows and lower high. Currently, the price is trading at 1.21167 and trading at key support level.
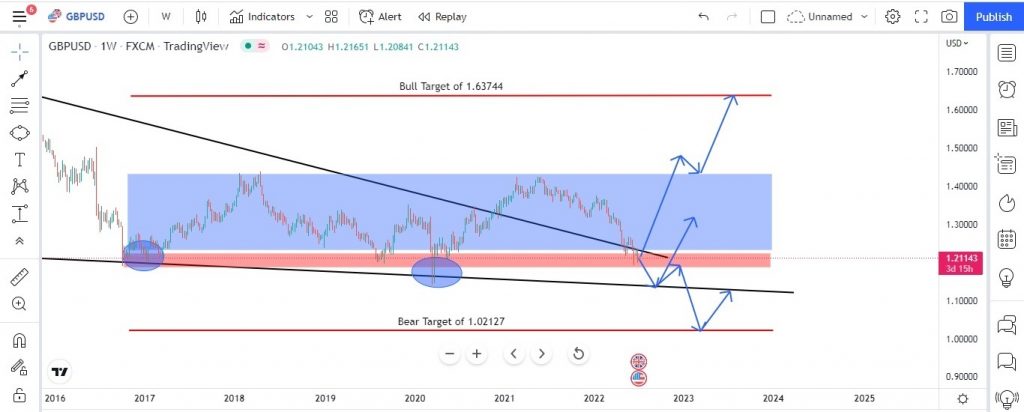
The above chart is also on a weekly time frame showing the possible price action movement with blue lines. If price from the consolidation phase breaks upside, the possible target for bull side will be at 1.63744 for which we need confirmation. One can initiate a buy position at the current level with stop loss just below the last swing low.
One can open their short position once the prices start trading below the red rectangle box and one need to wait for the retracement of the price to retest the support level. Only upon confirmation one can initiate a sell position with a target of 1.02127 with stop loss just place above the latest swing high.
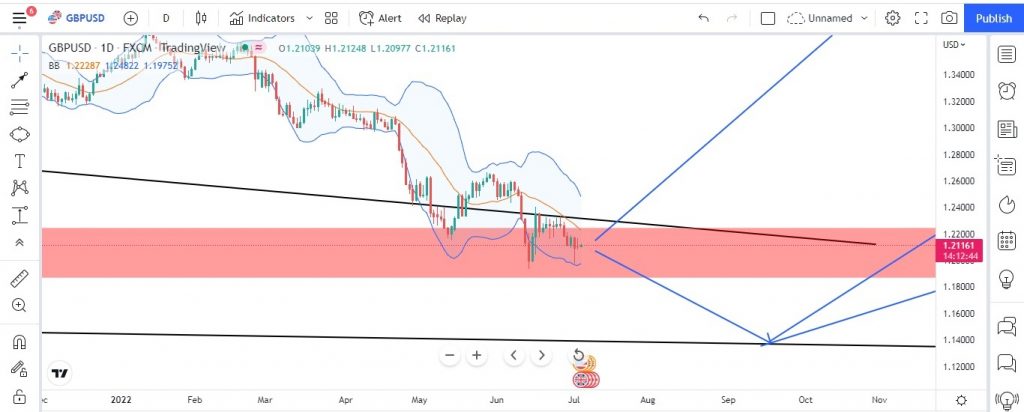
The below chart is for GBPUSD on a daily time frame plotted with Bollinger Band. Currently, the RSI is just below the 40 levels on a daily time frame and also a divergence is seen. Which is indicating, the prices may show a sign of bullishness in the coming days, also it may be noted that the prices are still in the consolidation phase, only a breakout above or below will make the prices more volatile and trending in the coming days.
Website Disclaimer
The Articles published in Blog sections of HFT Solutions, is for educational purpose only and the author is not a SEC registered analyst. The views and opinions expressed on this website are solely those of the original author(s) and other contributor(s). These views and opinions do not necessarily represent those of HFT Solutions, the https://hftsolution.com/ staff, and /or any/all contributors to this site.
All information on the Site is provided in good faith, however we make no representation or warranty of any kind, express or implied, regarding the accuracy, adequacy, validity, reliability, availability, or completeness of any information on the site. UNDER NO CIRCUMSTANCE SHALL WE HAVE ANY LIABILITY TO YOU FOR ANY LOSS OR DAMAGE OF ANY KIND INCURRED AS A RESULT OF THE USE OF THE SITE OR RELIANCE ON ANY INFORMATION PROVIDED ON THE SITE. YOUR USE OF THE SITE AND YOUR RELIANCE ON ANY INFORMATION ON THE SITE IS SOLELY AT YOUR OWN RISK.


