AUD/USD (Australian Dollar – US Dollar) is one of the most frequently-traded currency pairs in the world. In this case, the Australian Dollar (abbreviated AUD) is considered the base currency, and the U.S. Dollar (abbreviated USD) is considered the quote currency, or the denomination in which the price quote is given. The AUD/USD ranks as the 4th most liquid currency pairing, accounting for 6% of total transaction volume but is not one of the six currencies that make up the U.S. dollar index (USDX).
AUD/USD also referred to as a commodity currency, the Aussie has close correlation with commodity prices due to its traditional reliance on the trade of natural resources. Historically, yield differentials delivered strong demand for the Aussie Dollar through carry trades, making the Aussie Dollar a riskier asset. In recent years, record low interest rates have given the upper hand to the Greenback. While a commodity currency, the Aussie Dollar is also a proxy to the Chinese Yuan and sees material political and economic influence from China.
The AUD/USD tends to have a negative correlation with the USD/CAD, USD/CHF, and USD/JPY pairs because the AUD/USD is quoted in U.S. dollars, while the others are not. The correlation with USD/CAD could also be due to the positive correlation between the Canadian and Australian economies (both resource-dependent).
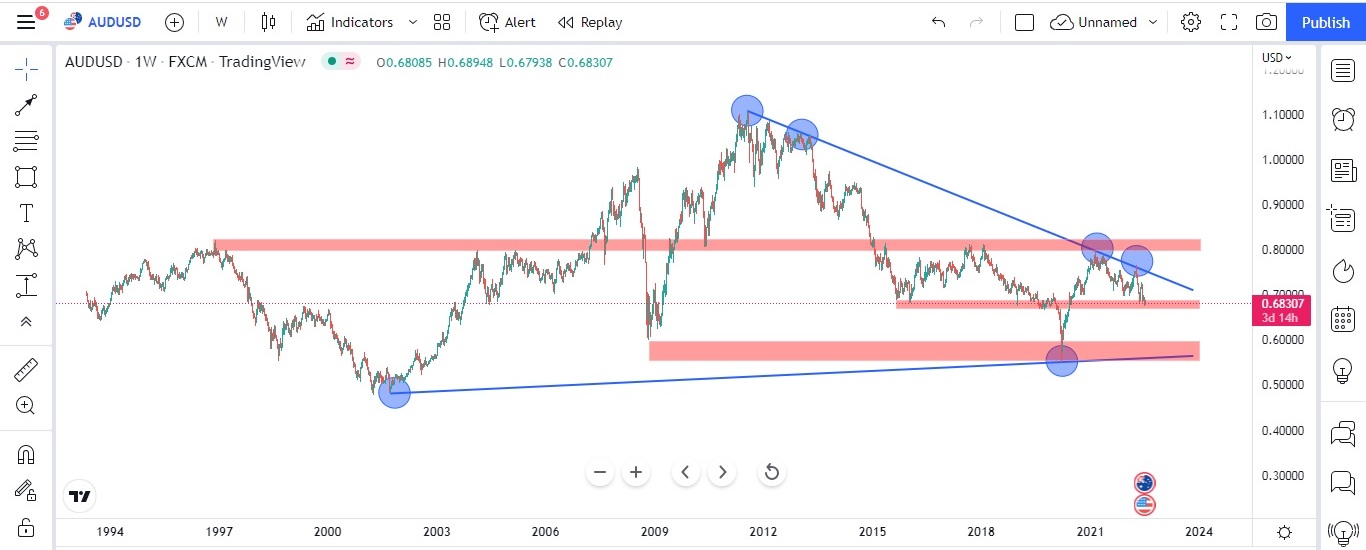
The AUDUSD is shown in below chart on a weekly time frame. One can see from the chart the prices of AUDUSD are too volatile and are fluctuating too often making it one of the riskier pair to trade. Currently the prices are trading in a wider descending triangle making lower lows and higher lows.
It was during the year 2009 to 2012 the prices has outperformed and the AUDUSD made an all time high of 1.10802 in the year 2011. Since then the prices are making new lower low and in fact it has also tested the key support area that has formed during the year 2008. In 2008, when the world market had recession, the prices made the low of 0.60212 and same has been retested during the Corona Pandemic 2020 by breaking the low of 2008 and one can clearly see, it took support from that levels and since then the prices were in uptrend till it got a strong resistance at the upper trend line drawn from the all time high.
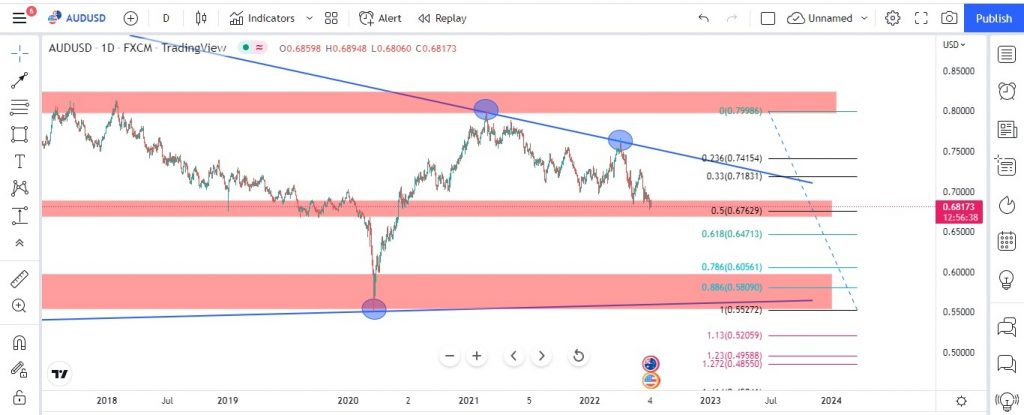
Below chart explains AUDUSD using Fibo ratio on a daily time frame. The price is trying to take support at 51% of Fibo which is at 0.67629. If price breaks the key support zone (red color) then the price will be heading towards the 61% & 78% of Fibo levels which are 0.64713 and 0.60561 levels. One can initiate a short position as soon as the support level is breached for a target of 61% & 78% of Fibo levels with stop loss just above the last swing high which will be at 0.72805 (only after breakdown of key support area with proper rejection when price try to retest the support level once again). One can go for buying once price reaches the 61 to 78% of Fibo levels with stop loss just below 0.55272 with an initial target of 0.67629 and 0.71831 respectively.
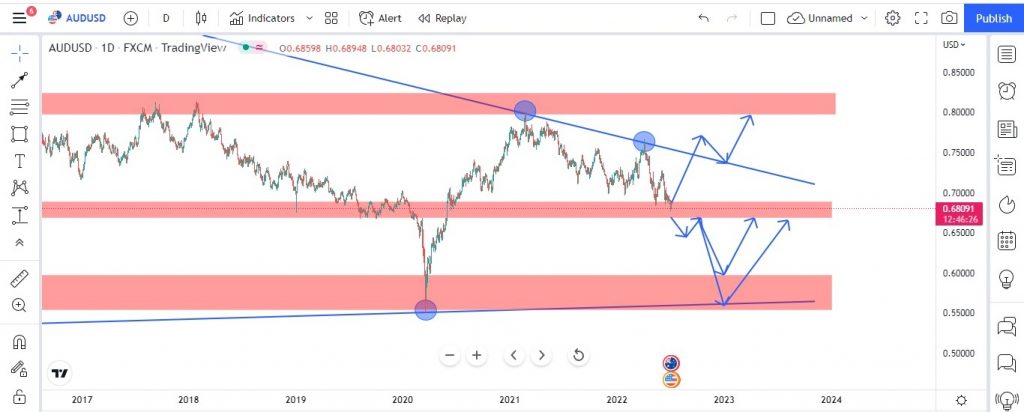
The below chart explain the possible price action movement that the AUDUSD can make on a daily time frame which are shown using blue arrows.
Website Disclaimer
The Articles published in Blog sections of HFT Solutions, is for educational purpose only and the author is not a SEC registered analyst. The views and opinions expressed on this website are solely those of the original author(s) and other contributor(s). These views and opinions do not necessarily represent those of HFT Solutions, the https://hftsolution.com/ staff, and /or any/all contributors to this site.
All information on the Site is provided in good faith, however we make no representation or warranty of any kind, express or implied, regarding the accuracy, adequacy, validity, reliability, availability, or completeness of any information on the site. UNDER NO CIRCUMSTANCE SHALL WE HAVE ANY LIABILITY TO YOU FOR ANY LOSS OR DAMAGE OF ANY KIND INCURRED AS A RESULT OF THE USE OF THE SITE OR RELIANCE ON ANY INFORMATION PROVIDED ON THE SITE. YOUR USE OF THE SITE AND YOUR RELIANCE ON ANY INFORMATION ON THE SITE IS SOLELY AT YOUR OWN RISK.