The E-Mini Dow (YM) is a financial futures instrument which enables traders to speculate on the future value of the Dow Jones Industrial Average (DJIA). The YM offers traders exposure to the 30 US-based blue –chip companies which compose the DJIA Index. This includes well established companies such as IBM, Caterpillar, Visa, McDonald’s, Boeing and Chevron. Instead of trading the equity products offered by each company, traders can gain exposure to all of them with one contract of the YM.
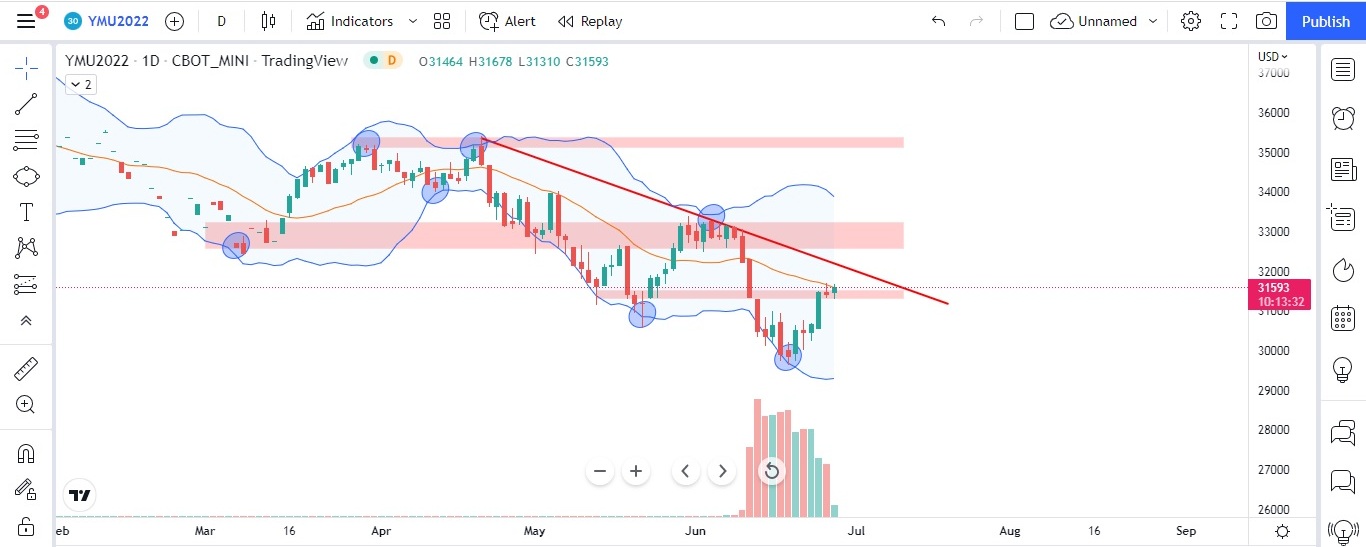
Below figure explain the current position for YM. It is clear that the YM for September 2022 contract has taken support at the Bollinger Band lower levels and one can also get the confirmation from volume (Inspite of increase in volume, the bears did not take the prices to new low and also the candle body size as compared to previous candle is very small, which is clearly reflected in volume).

At present level of 31,593, the price is trading at a crucial level of middle band of the Bollinger Band and also, we can see there is a major trend line resistance (red line –trend line). 32,000 levels will act as a psychological level, so bulls have to face multiple resistances. If broken upside levels and price sustain above 32,000 levels, the major pivot will be 33,200 levels which will be tested where, prices have already spend some days before making a new low.
The below figure explains using Fibo levels. At current prices, the price is testing 51% of Fibo levels, and we can see a small retracement has been made. If price breaks the 51% of Fibo levels, it can head towards the resistance zone and also this will be the confirmation. Also, one can get the confirmation from volume if price breaks the 51% of Fibo levels. The below chart is on a 4 hours time frame and Fibo is drawn using the last swing high and swing low.
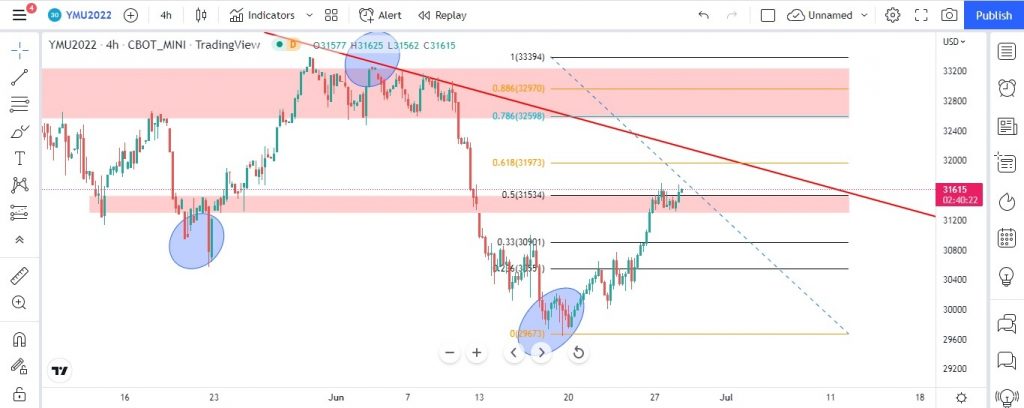
One can clearly see that price is trying to sustain above 51% of Fibo levels for which we need confirmation from volume. If price does not sustain above, chances are the price may take support at 26% which is about 30,550 levels and it will be the key support level to watch out for. If support level is broken then we can see another new low for YM, for which we need confirmation based on price action.
E-MINI DOW ($) FUTURE (YM) –SEP 2022: UPDATES AS ON: 07/07/22
The below updates is for the analysis that was done on 28th June 2022 for YM. It was mentioned in earlier analysis that price of YM was trading at a crucial point of 51% of Fibo levels and even the price was trading near the mean point of Bollinger band and also there was a trend line resistance just above the 61% of Fibo line which was keeping the prices in a bear territory. Below is the updated chart as on 7th July 2022.
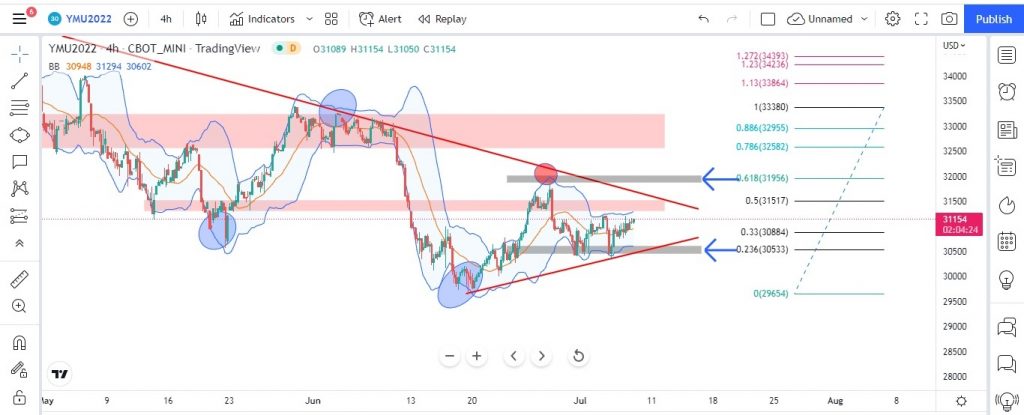
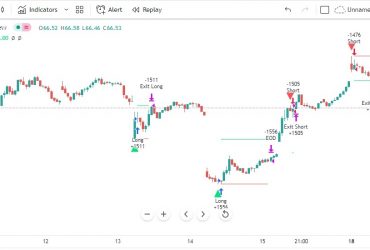
The prices of YM did not sustain above the level of 51% of Fibo levels we can see the prices tried to reach the 61.8% of Fibo levels that is where the bears tried to bring the prices to 23% of Fibo levels as mentioned in your earlier analysis of 28th June. The Fibo is drawn on the right side of the prices in the same chart. The red circles near the trend line is where the prices got rejection by making a bearish engulfing candle before the price heading towards the level of 23% of Fibo. The price took multiple support at the 23% (support zone is drawn and is highlighted in black color) and it got reversed. Currently, the prices are trading in a triangle pattern and have stopped making lower low. Below figure explains the buying opportunity along with proper risk to reward ratio at current market prices of YM on a 4 hours time frame which is trading at 31,170.
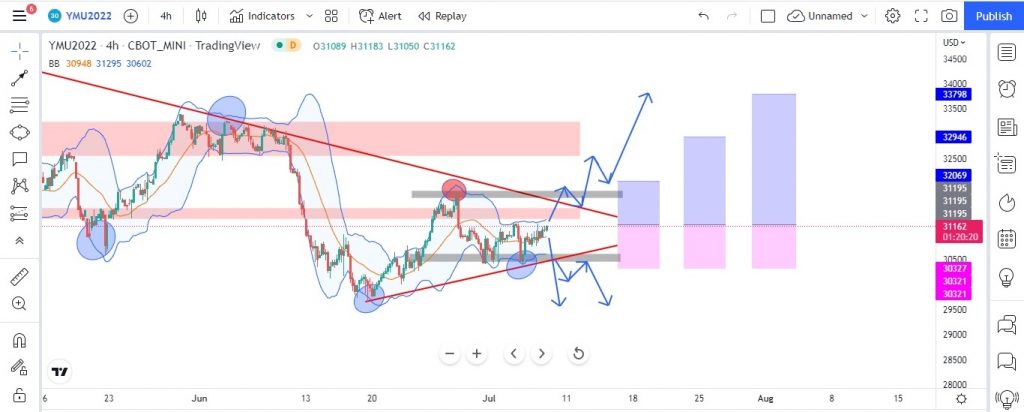
One can initiate a buying position in YM for September contract -2022 at current market price of 31,170. In the above chart, we have plotted the buying position size with entry at 31,170 and with stop loss at 30,327 with a risk to reward ratio of 1:1/1:2/1:3 (Target 1: 32,063; Target 2: 32,946 & Target 3: 33,798 respectively). Note, the prices has to face multiple resistance at 61% of Fibo ratio and 2nd resistance being the red trend line, which is holding the prices in a downtrend. Once prices sustain above these levels, we can expect a short term bullishness in the prices of YM.
If we draw a trend line on last month lowest price to recent lowest, this is currently acting as a key support levels. If prices break down the trend line, the possible price action movement it can make is shown in blue arrow for which we need further confirmation on price action. One can initiate the sell position as soon as we break the trend line along with other confirmation.
Please note, the above buy set up is only for risky trader since the main trend is downwards and we are trading against the main trend. The reason for giving buy set up at current levels is because the risk to rewards is best suiting at current positions.
E-MINI DOW ($) FUTURE (YM) –SEP 2022: UPDATES AS ON 20th JULY 2022
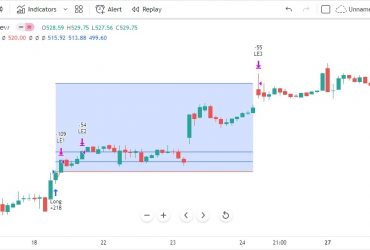
As per our previous analysis we have given a buy call at $ 31,170 level with stop loss at $ 30,327. As on 13th July the major inflation data has came out and market became volatile because of which our stop loss got triggered. As soon as our stop loss triggered the market gave a false breakdown and prices of YM got bounced exactly from our stop loss level. The reason is RSI has made a bullish hidden divergence (See RSI chart with red arrow) and also if we draw the Fibo levels, from last swing high and swing low. It is exactly at 78% of Fibo levels where the prices got bounced and trapped most of the sellers.
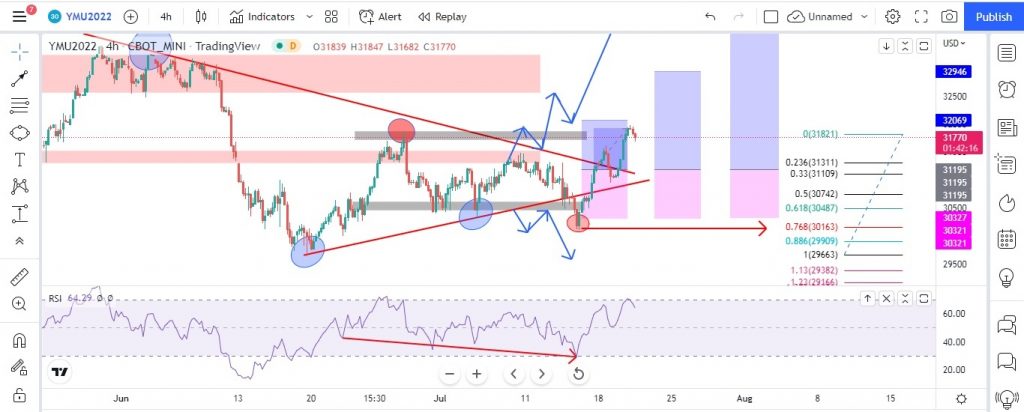
Above chart of YM plotted on 4 hour timeframe is the updated chart as on 20th July 2022. Also plotted RSI with divergence and Fibo levels where the prices of YM got reversed and trapped most of the sellers.
One can place a buy order at same level of $ 31,170 level with same stop loss or they can trade at the breakout of recent swing high which is $ 31,980 with stop loss being placed just below the last swing low with targets of 1:1 and 1:2.
Website Disclaimer
The Articles published in Blog sections of HFT Solutions, is for educational purpose only and the author is not a SEC registered analyst. The views and opinions expressed on this website are solely those of the original author(s) and other contributor(s). These views and opinions do not necessarily represent those of HFT Solutions, the https://hftsolution.com/ staff, and /or any/all contributors to this site.
All information on the Site is provided in good faith, however we make no representation or warranty of any kind, express or implied, regarding the accuracy, adequacy, validity, reliability, availability, or completeness of any information on the site. UNDER NO CIRCUMSTANCE SHALL WE HAVE ANY LIABILITY TO YOU FOR ANY LOSS OR DAMAGE OF ANY KIND INCURRED AS A RESULT OF THE USE OF THE SITE OR RELIANCE ON ANY INFORMATION PROVIDED ON THE SITE. YOUR USE OF THE SITE AND YOUR RELIANCE ON ANY INFORMATION ON THE SITE IS SOLELY AT YOUR OWN RISK.